From the Plots menu, Keyforms are self-measuring and diagnosing forms, such as the KeyMath diagnostic profile, and the KeyFIM. These are a powerful application of Rasch measurement for instantaneous use. These are plotted in horizontal or vertical format using Excel - but be patient, Excel is somewhat slow to display them. The keyform can be plotted with either horizontal or vertical orientation. In earlier version of Winsteps, these were specified by KEYFORM=
The 7 columns in the Excel Worksheet are:
For points in the KeyForm:
COLUMN The horizontal location (x-axis) in the vertical layout or vertical location (y-axis) in the horizontal layout.
MEASURE The measure (y-axis) in the vertical layout or (x-axis) in the horizontal
POINT-LABEL The value with which to label the point. Use the Excel point-label add-in at www.winsteps.com/ministep.htm
For column (row headings)
COLUMN The horizontal location (x-axis) in the vertical layout or vertical location (y-axis) in the horizontal layout.
HEAD-MEASURE The top-of-column measure (y-axis) in the vertical layout or end-of-row (x-axis) in the horizontal
ITEM-ID The item number
ITEM-LABEL The item identifying label
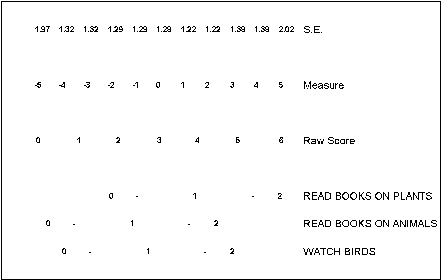
Example: For the first 3 items of the "Liking For Science" Data
with Excel, produces vertical plots like: (These can be plotted directly from the Plots menu.)
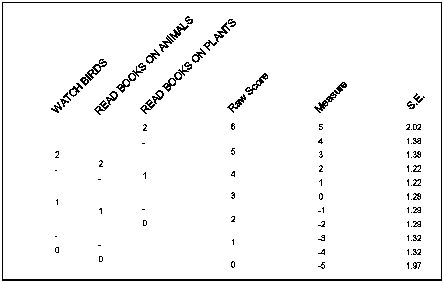
with Excel, produces horizontal plots like: (These can be plotted directly from the Plots menu.)
Adding person-measure-related information:
Run Winsteps, "Plots", "Vertical Keyform". This gives you am Excel plot with raw scores down the right-hand side.
Click on the Excel worksheet tab (usually below the plot).
The "raw scores" are in a block below the items.
Insert more blank rows below the raw score block (and above the next block) the same as the raw score block with a blank row each side.
Copy the raw score block into the inserted rows, with a blank row beneath the raw score block and a blank row above the next block.
Add 2 to the highest value in column A and put this value in column A of your new block.
Replace the raw score in your new block with the information you want for each raw score
The plot should now show the person information to the right of the raw scores.