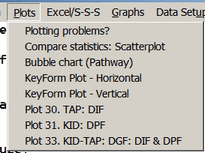
Here is the Plots menu. |
|
these are usually due to the Winsteps-Excel interface. See www.winsteps.com/problems.htm |
|
enables you to draw scatterplots (xyplots) of Winsteps statistics within or between analyses. It also produces the tabular output of Table 34. |
|
generates a Bond & Fox-style bubble chart. |
|
Keyform Plot - Horizontal |
generates a horizontal keyform layout. |
Keyform Plot - Vertical |
generates a vertical keyform layout. |
DIF plots the DIF values in Table 30. |
|
DPF plots the DPF values in Table 31. |
|
DIF & DPF plots the DIF+DPF values in Table 33. |
|