Differential item functioning (DIF) an be investigated using log-odds estimators, Mantel-Haenszel (1959) for dichotomies or Mantel (1963) for polytomies. The sample is divided into difference classification groups (also called reference groups and focal groups) which are shown in Table 30 and specified with DIF=. And then sliced into strata by ability measure (equivalent to raw score for complete data).
The usual M-H computation stratifies the sample by raw scores, so it works with case-wise deletion of cases with missing data. Winsteps stratifies cases by measure, so cases with missing data are stratified at their estimated measure. For complete data and thin-slicing, the conventional M-H computation and the Winsteps M-H computation produce the same numbers. With missing date or thick-slicing, the conventional M-H computations and the Winsteps M-H computations may differ.
M-H and the t-tests in Winsteps should produce the same results, because they are based on the same logit-linear theory. But, in practice, M-H will be more accurate if the data are complete and there are large numbers of subjects at every score level, so called "thin" matching. Under other circumstances, M-H may not be estimable, or must use grouped-score "thick" matching, in which case the t-test method will probably be more accurate. Similar conclusions can also be inferred from http://www.eric.ed.gov/ERICWebPortal/custom/portlets/recordDetails/detailmini.jsp?_nfpb=true&_&ERICExtSearch_SearchValue_0=ED334230&ERICExtSearch_SearchType_0=no&accno=ED334230
MHSLICE= controls the width of each slice, thin or thick. MHSLICE= specifies the width of the slice (in logits) of the latent variable be included in each cross-tab. The lower end of the lowest slice is always the lowest observed person measure.
MHSLICE = 0 bypasses Mantel-Haenszel or Mantel computation.
MHSLICE = .1 logits and smaller. The latent variable is stratified into thin slices. This corresponds to the slicing by raw scores with complete data
MHSLICE = 1 logit and larger. The latent variable is stratified into thick slices.
For each slice, a cross-tabulation is constructed for each pair of person classifications against each scored response level. An odds-ratio is computed from the cross-tab. Zero and infinite ratios are ignored. A homogeneity chi-square is also computed when possible.
Thin slices are more sensitive to small changes in item difficulty across person classifications, but more persons are ignored in inestimable cross-tabs. Thick slices are more robust because fewer persons are ignored. Use the Specification pull-down menu to set different values of MHSLICE= and then produce the corresponding Table 30.
In principle, when the data fit the Rasch model, the Mantel and Mantel-Haenszel estimators should concur with the Rasch DIF contrast measures. The Rasch DIF contrast weights each person equally. Mantel weights each cross-tabulation equally. Thus when the DIF estimates disagree, it indicates that the DIF in the data is non-uniform with ability level.
Computation:
Person classification groups are A, B, ... They are compared pairwise. Starting from the lowest person measure, each slice is MHSLICE= logits wide. There are K slices up through the highest person measure. For the target item, in the kth slice and comparing classification groups A and B, with categories renumbered from 0 to simplify the computation,
Person Classification Groups by j=0,J categories by k=1,K ability strata (slices) |
||||||||
|
|
Rating-Scale Category |
|
|||||
|
g |
j=0 |
1 |
2 |
3 |
j |
J |
Total: |
Score: |
|
Y0 |
Y1 |
Y2 |
Y3 |
Yj |
YJ |
|
Reference classification group |
1 |
nk10 |
nk11 |
nk12 |
nk13 |
nk1j |
nk1J |
Nk1 |
Focal classification group |
2 |
nk20 |
nk21 |
nk22 |
nk23 |
nk2j |
nk2J |
Nk2 |
Total: |
|
Mk0 |
Mk1 |
Mk2 |
Mk3 |
Mkj |
MkJ |
Tk |
Then the Mantel (1963) or Mantel-Haenszel (1959) DIF chi-square for the target item is:
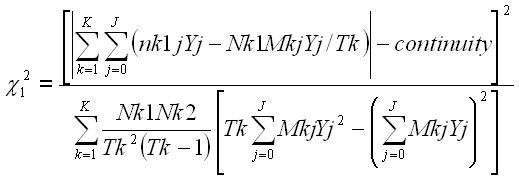
where continuity = 0.5 for dichotomies and = 0 for polytomies.
The Mantel-Haenszel (1959) log-odds estimator for dichotomies and the Liu-Agresti (1996) cumulative log-odds estimator for polytomies are:

Liu, I-M, & Agresti, A. (1996). Mantel-Haenszel-type inference for cumulative odds ratios with a stratified ordinal response. Biometrics, 52, 1223-1234.
Mantel N. (1963) Chi-square tests with one degree of freedom: extensions of the Mantel-Haenszel procedure. J Amer Stat Assoc 58, 690-700.
Mantel, N. and Haenszel, W. (1959) Statistical aspects of the analysis of data from retrospective studies of disease. J Natl Cancer Inst 22, 719-748.
ETS DIF Category |
DIF Contrast (Logits) |
DIF Statistical Significance |
C = moderate to large |
|DIF| >=1.5 / 2.35 = 0.64 |
p( |DIF| ≤1/2.35 = 0.43) < .05 |
B = slight to moderate |
|DIF| >= 1/2.35 = 0.43 |
p( |DIF| <0) < .05 |
A = negligible |
|
|
C-, B- = DIF against focal group |
||
ETS (Educational Testing Service) use Delta units. 1 logit = 2.35 Delta units. 1 δ = (4/1.7) ln(α), where α is the odds-ratio. |
||
Zwick, R., Thayer, D.T., Lewis, C. (1999) An Empirical Bayes Approach to Mantel-Haenszel DIF Analysis. Journal of Educational Measurement, 36, 1, 1-28 |
||
Example:
----------------------------------------------------------------------------------------------------------------
| PERSON DIF DIF PERSON DIF DIF DIF JOINT Welch Mantel-Haenszel Size ITEM |
| CLASS MEASURE S.E. CLASS MEASURE S.E. CONTRAST S.E. t d.f. Prob. Chi-squ Prob. CUMLOR Number Name |
|--------------------------------------------------------------------------------------------------------------|
| A 1.47 .28 P 2.75 .33 -1.28 .43 -2.96 102 .0038 7.198 .0073 -1.20 1 Response|
|--------------------------------------------------------------------------------------------------------------|
Size of Mantel-Haenszel slice = .100 logits
title="MH computation"
; d.f.=1 chi=7.198 p=0.073
; log-odds = -1.20
codes=01
clfile=*
1 Better
0 Same
*
item1=1
name1=1
NI=1
pweight=$s9w2 ; weighting substitutes for entering multiple records
PAFILE=$S6W1 ; anchoring forces stratification
DIF = $4W1 ; cross-tab by Gender, F or M
&end
Response
;234567890
END LABELS
1 FA 1 16
0 FA 1 11
1 FP 1 5
0 FP 1 20
1 MA 2 12
0 MA 2 16
1 MP 2 7
0 MP 2 19