Output Tables are listed in the Output Table Index. They are written into temporary files if selected from the Output Tables menu. Output Tables are written into the Report Output File if specified using TABLES= or TFILE= in the control file. Table 0 is always written to the Report Output File.
Click on the Table name to go to the Table description:

3.2 Rating (partial credit) response-structure and most Tables shown
Click on the Table to write it to a file and show it on the screen. Here is "3.2 Rating response-structure Structure". It is written into temporary file 03-859ws.txt. "03" refers to Table number 3. "859" is a unique number for this analysis. "ws.txt" means "Winsteps text file".
TABLE 3.2 LIKING FOR SCIENCE (Wright & Masters p. ZOU859ws.txt Oct 9 10:54 2002
INPUT: 76 PUPILS, 25 ACTS REPORTED: 75 PUPILS, 12 ACTS, 3 CATS WINSTEPS 3.36
--------------------------------------------------------------------------------
SUMMARY OF CATEGORY STRUCTURE. Model="R"
+------------------------------------------------------------------
|CATEGORY OBSERVED|OBSVD SAMPLE|INFIT OUTFIT|| ANDRICH |CATEGORY|
|LABEL SCORE COUNT %|AVRGE EXPECT| MNSQ MNSQ||THRESHOLD| MEASURE|
|-------------------+------------+------------++---------+--------+
| 0 0 667 33| -1.30 -1.30| .96 .95|| NONE |( -2.04)| 00 dislike
| 1 1 757 37| -.08 -.09| .90 .78|| -.82 | .00 | 01 neutral
| 2 2 609 30| 1.40 1.41| 1.09 1.33|| .82 |( 2.04)| 02 like
+------------------------------------------------------------------
AVERAGE MEASURE is mean of measures in category.
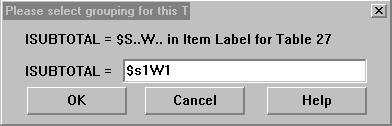
Tables 27, 28, 30, 31, 33
These all allow the user to change the relevant control command on execution. ISUBTOTAL= controls the sub-total segments for Table 27 with a selection command so you are asked to confirm or change this value, before the Table is produced.
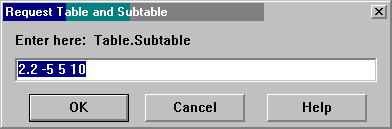
Any Table (except Table 0) can be displayed using this command. It also accepts the special fields available with TFILE=
Weight Selection. See weighting. When IWEIGHT= or PWEIGHT= are used in estimation, reports can be adjusted to reflect those weights or not. Weights of zero are useful for pilot items, variant items or persons with unusual characteristics. These can be reported exclusively or excluded from reports.