On the Graphs menu, click on "Display by item" or "Display by scale group"
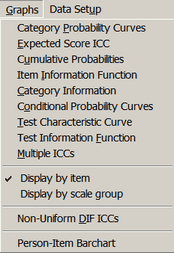
Click on "Category Probability Curves"
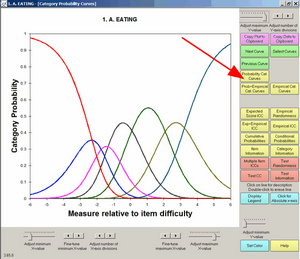
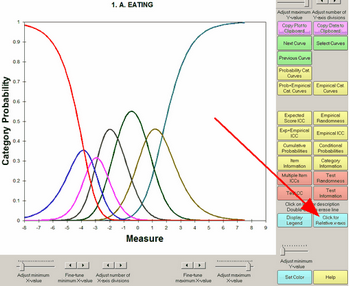
Select by clicking on "Probability Cat. Curves" in the Graph or from the Graphs menu.
Buttons are described in Graph window.
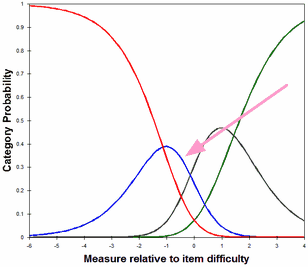
This shows the probability of observing each ordered category according to the Rasch model. To identify a category, click on it:
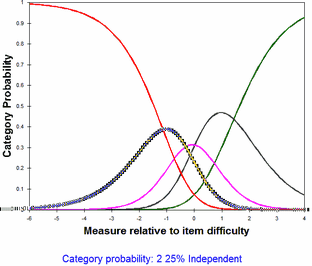
The caption can be clicked on and moved. "2" is the category score. "25% independent" is the category description from CFILE= or CLFILE=. To clear the black highlighting, click somewhere else on the plot.
To delete the line corresponding to a category, double-click on it:
For individual items, the horizontal scaling can be changed from relative to item difficulty to relative to the latent variable by clicking on "Click for Absolute x-axis":