(controlled by MRANGE=, MAXPAGE=, T1I#=, T1P#=)
This table shows the distribution of the persons and items. The variable is laid out vertically with the most able persons, and most difficult items at the top. For rating (or partial credit) scales, each item is shown three times in Table 1.4. In the center item column, each item is placed at its mean calibration, i. e., this is the location of the center of the rating (or partial credit) scale - the location at which being ratings in the top and bottom category are equally probable. In the left-hand item column, the item is shown at the measure level (Rasch-Thurstone threshold) corresponding to a probability of .5 of exceeding (or being rated in) the bottom rating (or partial credit) scale category. In the right-hand item column, the item is shown at the measure level corresponding to a probability of .5 of being rated in (or falling below) the top rating (or partial credit) scale category. These locations are also shown in Table 2.3. Dichotomous items, "D", have only one location. The plotted values are in the ISFILE=.
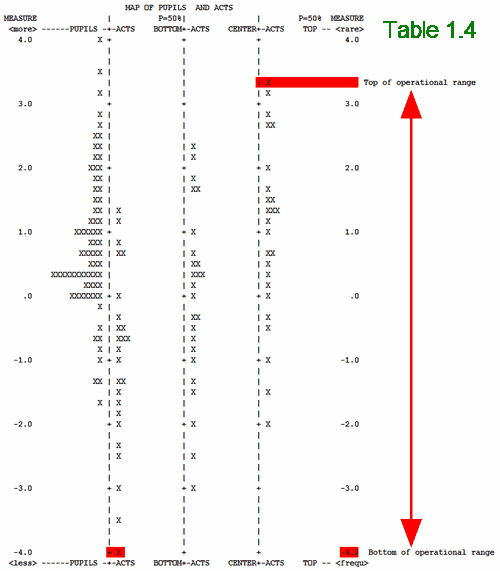
In Table 1, each person or item is indicated by an "X", or, when there are too many "X"s to display on one line, several persons or items are represented by a "#". Less than that number by ".". So that if "#" represents 4, then "." represents 1 to 3.
The left-hand column locates the person ability measures along the variable. Observe that the top pupil (left column) is well above the top category of the most difficult act item (right-most column), but that all pupils are above the top category of the easiest item (bottom X in right-most column). "Above" here means with greater than 50% chance of exceeding.
Effective operational range of an instrument. Everyone between the extreme 50% cumulative thresholds (red bands in the Figure) has a more that 50% chance of being rated above the bottom category of at least one item and below the top category of at least one item.
Table 1.2 is enough if the data are dichotomies. Then each item has an operational range of about 1.5 logits up and down from the item difficulty. for an ability at 1.5 logits from the difficulty of a dichotomous item, the response to the item contain about 60% of the statistical information of a response for an ability equal to the item difficulty.
Here we have polytomies (rating scale, partial credit), so each item has a range from the bottom category of the rating scale (2nd column in Table 1.4) through the overall item difficulty (3rd column in Table 1.4) to the top category of the rating scale (4th column Table 1.4).
In Table 1.2 the x's are located at the point where there is a 50% chance of being observed in the bottom category and a 50% chance of being observed in the top category. For dichotomies, there are only 2 categories, so this is the whole story.
In Table 1.4, the x's in the 2nd column are located at the points on the latent variable where a person would have a 50% chance of being observed in the bottom category and a 50% chance of being observed in a higher category. So this is like the "item difficulty" of the bottom category.
In Table 1.4, the x's in the 4th column are located at the points on the latent variable where a person would have a 50% chance of being observed in the top category and a 50% chance of being observed in a lower category. So this is like the "item difficulty" of the top category.
So the item difficulty of each item covers the whole range in Table 1.4 from its x in the 2nd column to its x in the 4th column.