Do not use this file for anchor values. Instead use IFILE= (becomes IAFILE=) and SFILE= (becomes SAFILE=).
Communicating the functioning of a rating scale is challenging, especially if your audience think of its categories as separate and equally-spaced points on the latent variable.
If you want to communicate the categories as points, then the best points for the intermediate categories are the locations on the latent variable at which the probability of observing each category is the highest. These are also the points where the expected score on the item is the category value. In Winsteps these are the "AT CAT" measures in the ISFILE= output file. These points are at infinity for the extreme categories, so Winsteps reports the measures for expected scores of "lowest category + 0.25" ( = CAT +0.25) and "highest category - 0.25" (= CAT - 0.25).
The Rasch-Thurstone thresholds (50%PRB in ISFILE=) dichotomize the rating scale at each category boundary into 50% probability of being observed below the category and 50% probability of being observed in or above the category.
The points on the latent variable where the expected scores are 2.5, etc., are called the CAT-0.5 points in ISFILE=.
The Rasch item difficulty (in IFILE=) is the point on the latent variable at which the highest and lowest categories are equally probable.
ISFILE=? opens a Browse window
ISFILE=filename produces an output file containing the category structure measure information for each item. All measures are added to the corresponding item's calibration and rescaled by USCALE= and UDECIMALS=. This file contains 4 heading lines (unless HLINES=N), followed by one line for each item containing:
Columns: |
|||
Start |
End |
Heading |
Description |
1 |
1 |
|
Blank or ";" if no responses or deleted (status = -2, -3) |
2 |
6 |
ENTRY |
The item sequence number |
7 |
11 |
STATUS |
2. The item's status 1 = Estimated calibration 2 = Anchored (fixed) calibration 3 = Anchored (fixed) calibration with extreme (minimum or maximum) observed raw score 0 = Extreme minimum (estimated using EXTRSC=) -1 = Extreme maximum (estimated using EXTRSC=) -2 = No responses available for calibration -3 = Deleted by user |
12 |
5 |
MAXIMUM |
Number of active categories |
17 |
5 |
CAT |
Lowest active category number |
22 |
29 |
CAT+.25 |
Measure for an expected score of bottom category + LOWADJ= Useful as a measure for a performance in the bottom category, for which the performance range extends to -infinity. |
The following fields are repeated for the remaining active categories: |
|||
30 |
34 |
CAT |
Active category number |
35 |
39 |
STRUCTURE |
Ordered category number in structure = "Step counting from zero" |
40 |
47 |
MEASURE |
Structure measure = Rasch-Andrich threshold + item measure = Dij. Do not use for anchoring. Use SFILE= and IFILE= for SAFILE= and IAFILE= |
48 |
55 |
ERROR |
Rasch-Andrich threshold's standard error, with the item difficulty S.E. assumed to be 0.0. |
56 |
63 |
CAT-0.5 |
Measure for an expected score of category - 0.5 score points. This is the Rasch-half-point threshold, the boundary between categories when conceptualized as average performances. It is not a model parameter. |
64 |
71 |
AT CAT |
Measure for an expected score of category score points (AT CAT). This is the measure corresponding to a category when predicting for an individual or sample about which nothing else is known. |
72 |
79 |
50%PRB |
Measure at 50% cumulative probability. This is the Rasch-Thurstone threshold. These can be used as parameter estimates for a Rasch-Thurstone model. They are not the parameter estimates of Leon Thurstone's "normal" model, nor of Samejima's "graded response" model. |
|
|
CAT-0.25 |
For the top category this value corresponds to the top category value less HIADJ= , the measure for an expected score of HIADJ= score points less than the top category value. Useful as a measure for a performance in the top category, for which the performance range extends to infinity. |
The "AT CAT" values in the ISFILE= are based on the Rasch-model. They are the points on the "expected score" ogive for the rating scale (also called "the model ICC") at which the expected score = the category number. This is also the point at which the probability of observing the category is highest. For extreme categories (top and bottom of the rating scale), the model values are infinite, so an adjustment is made. The "AT CAT" values correspond to expected scores bottom+0.25 score points and top-0.25 score points. These provide reasonable estimates for performance in the extreme categories of the rating scale. The adjustment of 0.25 can be changed with LOWADJ= and HIADJ=. The "AT CAT" values are plotted on Table 2.2.
Since the ISFILE= has the same number of category entries for every item, the repeated fields are filled out with "0" for any further categories up to the maximum categories for any item.
When CSV=Y, commas separate the values with quotation marks around the "Item name". When CSV=T, the commas are replaced by tab characters.
When STKEEP=YES and there are intermediate null categories, i.e., with no observations, then the structure calibration into the category is set 40 logits above the previous calibration. The structure calibration out of the category, and into the next category, is set 40 logits above. Thus:
Structure Calibration |
||
Category |
in Table 3.2 |
in SFILE= |
0 1 2 3 |
NULL -1.00 NULL 1.00 |
0.00 -1.00 39.00 -38.00 |
Total: |
0.00 |
0.00 |
Meanings of the columns
There are several ways of conceptualizing the category boundaries or thresholds of a rating (or partial credit) scale item. Imagine a rating (or partial credit) scale with categories, 1, 2, 3:
From the "expected score ogive", also called the "model item characteristic curve"
Average rating: |
Measure (must be ordered) |
1.25 |
Measure for an expected score of 0.25 (CAT+.25) when LOWADJ=0.25 |
1.5 |
Measure for an expected score of category - 0.5 score points (CAT-0.5) |
2.0 |
Measure for an expected score of category score points (AT CAT) |
2.5 |
Measure for an expected score of category - 0.5 score points (CAT-0.5) |
2.75 |
Measure for an expected score of category score points (AT CAT) |
From the "category probability curves" relative to the origin of the measurement framework (need not be ordered)
1-2 equal probability |
Structure measure = Rasch-Andrich threshold + item measure = Dij (MEASURE) |
standard error |
Rasch-Andrich threshold's standard error (ERROR) |
2 maximum probability |
Measure for an expected score of category score points (AT CAT) - (yes, same as for the ogive) |
2-3 equal probability |
Structure measure = Rasch-Andrich threshold + item measure = Dij (MEASURE) |
standard error |
Rasch-Andrich threshold's standard error (ERROR) |
From the "cumulative probability curves" (preferred by Thurstone) (must be ordered)
Category 1 at .5 probability |
Measure at the 50% cumulative probability (50%PRB) |
Category 1+2 at .5 probability |
Measure at the 50% cumulative probability (50%PRB) |
Example 1: You wish to write a file on disk called "ITEMST.FIL" containing the item statistics reported in Table 2.2, for use in constructing your own tables:
ISFILE = ITEMST.FIL
ISGROUPS = 0 ; each item has its own "partial credit" scale
LOWADJ = 0.25 ; the standard for the low end of the rating scale
HIADJ = 0.25 ; the standard for the high end of the rating scale
;ENTRY STAT MAX CAT CAT+.25 CAT STRU MEASURE ERROR CAT-0.5 AT CAT 50%PRB CAT STRU MEASURE ERROR CAT-0.5 CAT-.25 50%PRB
1 1 2 0 -2.47 1 1 -1.25 .00 -1.58 -.40 -1.40 2 2 .46 .00 .79 1.68 .61
2 1 2 0 -2.78 1 1 -1.57 .00 -1.89 -.71 -1.71 2 2 .15 .00 .48 1.37 .29
"ENTRY" is the item entry number
"STAT" is the item status, see IFILE=
"MAX" is the highest category
"CAT" is the current category
"CAT+0.25" is the measure corresponding to an expected score of the lowest category+0.25 score points on the item
"STRU" (structure calibration) or step measure is a Rasch model parameter estimate (Rasch-Andrich thresholds), also the point at which adjacent categories are equally probable. See "Category probability curves" graph.
"MEASURE" is the item difficulty + structure calibration.
"ERROR" is an estimate of the standard error. It is reported as .00 if it is not known.
"CAT-0.5" is the location where the expected score on the item is the category half-point value, e.g., for a scale for 0,1,2 the "CAT-0.5" values correspond to expected scores of 0.5 and 1.5. See the "Expected score ICC" graph.
"AT CAT" is the location where the expected score on the item is the category point value, e.g., for a scale for 0,1,2 the "At step" values correspond to expected scores of 0.25, 1, and 1.75. Since the "at step" values 0 and 2 are infinite they are reported for 0.25 and 1.75. See the "Expected score ICC" graph.
"50%PRB" is the location of the Rasch-Thurstone threshold, the point at which the probability of all categories below = the probability of all categories at or above. See the "Cumulative probabilities" graph.
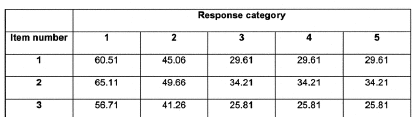
Example 2: To produce a Table of expected measures per item-category similar to Pesudovs, K., E. Garamendi, et al. (2004). "The quality of life impact of refractive correction (QIRC) questionnaire: Development and validation." Optometry and Vision Science 81(10): 769-777, write the ISFILE= to Excel. Then delete or hide unwanted columns.
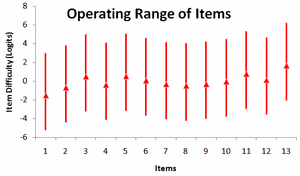
Example 2: To plot the operating range of each item using Excel.
"Output Files", "ISFILE=", output to Excel.
"Output Files", "IFILE=", output to Excel.
Paste the "MEASURE" from the IFILE= into the ISFILE=
Arrange the columns: TOP-.25, BOT+.25, MEASURE
Draw a hi-lo-close plot with TOP-.25, BOT+.25, MEASURE for each item
This is one I have drawn from Exam12.txt with Exam12lo.txt+Exam12hi.txt