Previous Next


Labor > Manager Tools > Forecasting

Forecasting
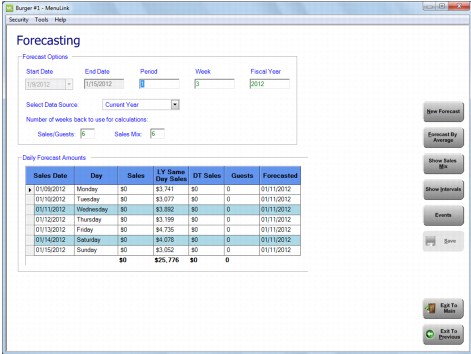
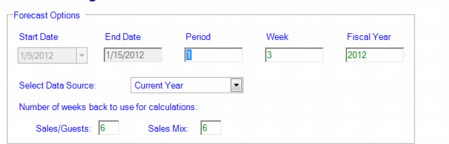
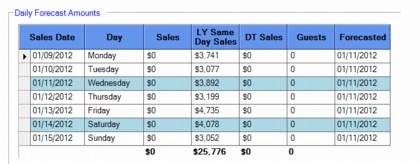
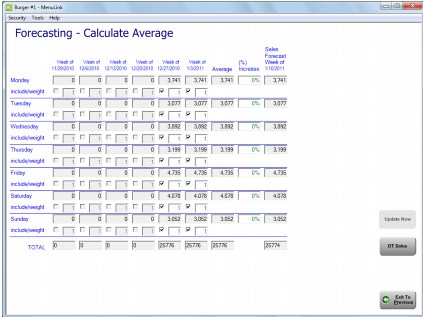
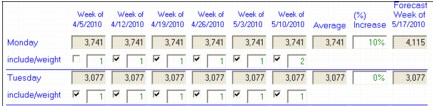
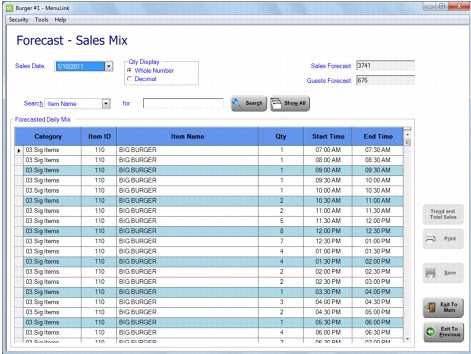
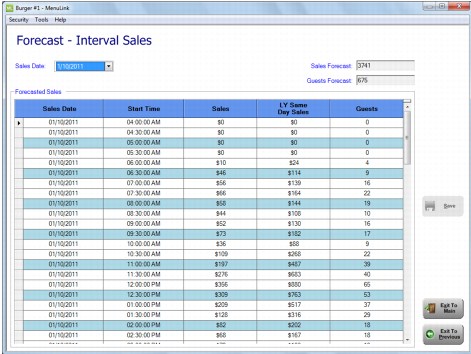
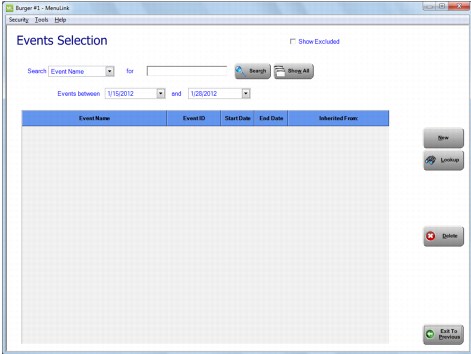
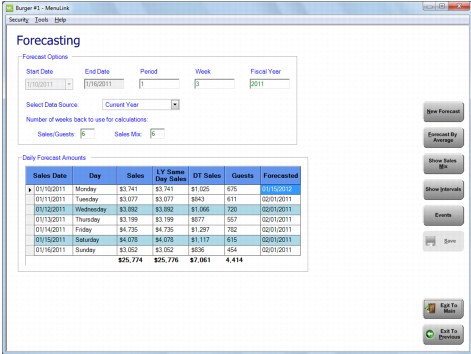
Forecasting is a feature that projects sales and guest counts for future weeks using sales data collected in the Inventory System through the POS Import process. The system calculates a forecast for each day of the selected week using last year’s data or this year’s data. This feature forecasts sales and guest counts both daily and per interval. It also forecasts sales mixes. These forecasts are used in several MenuLink Client features including Order by Forecasting, Prep Scheduling, and recommended staffing based on your Staffing Matrix.
Note: The following examples use a 30 minute time interval. Depending on your system settings, your time interval may be 30 or 15 minutes in length.
Creating a New Forecast
To create new sales and guest forecast:
1.
In the Manager ToolsScreen, click Forecasting. This opens the Forecasting screen.
Note: You can also access Forecasting through the Sales screen by clicking Forecasts.
2.
In the Forecasting screen, enter the period and week number to define the date range you want to forecast.
3.
Current Year uses recent sales history to calculate a forecast
Previous Year uses data from last year to calculate a forecast
4.
Enter the number of weeks for MenuLink Client to consider when calculating the forecast, with six (6) being the minimum number allowed. Generally, you can use the default setting. If recent events have affected your sales – for example if summer vacation started two weeks ago – you may want to adjust this setting.
5.
Click New Forecast.
MenuLink Client generates the sales and guest forecast which are displayed in the Forecast Daily Amounts area.
6.
7.
Click Save to keep your changes.
Forecast by Average
The Forecast by Average feature shows the individual sales forecasted for each day based on information from up to six prior weeks. You can change the sales forecast, percentage of increase (or decrease), days to exclude from the calculation, and the weight.
To create a forecast by average:
1.
Note: The amount in the average column indicates what MenuLink Client calculated as the average for those weeks. For example, the average for Tuesday was calculated as follows: ($3741+$3741+$3741+$3741+$3741)/5 = $3741. Note the week of 4/5/2010 was excluded from this calculation.
2.
Enter a value in the (%) Increase column to adjust this average upwards or downwards by a certain percentage. Enter negative values to decrease this value. For example, if you are expecting a local convention next week, you may want to increase the forecast by 10%.
3.
To exclude a sales amount from the average calculation, clear include/weight for that day.
Note: MenuLink Client may automatically exclude the high and low sales for a selected week, as defined by your MenuLink Administrator.
4.
To change the weight of a sales amount used in the average calculation, enter the number that you want to assign that sales amount in the box below the day’s sales amount. This can be useful if a particular day had unusually large or small sales, or if you prefer to weight more recent days higher than less recent days.
Note: Only whole numbers greater than or equal to one can be used.
CL_FCast_CalcAverageExclDetail
5.
Click Update Now to apply the changes to the forecast.
6.
Click Save to keep your changes.
Show Sales Mix
Use the Show Sales Mix feature to show the forecasted sales mix for the selected day.
To view a daily sales mix:
1.
2.
3.
Click Exit to Previous to return to the Forecast screen.
Show Intervals
Use the Show Intervals feature to view the forecasted sales and guests broken down into a predefined interval (15 minutes, 30 minutes or 60 minutes) for the selected date.
To create a Sales and Guest Interval forecast:
1.
2.
3.
Click Exit to Previous to return to the Forecast screen.

Events
The Events feature is used to create a forecast for a special event, such as a local convention, a special promotion, or a sporting event.
To add an event:
1.
2.
In the Event Selection screen, click New. The Event Maintenance screen appears.
3.
Enter the Name and ID number for the event. You can use any ID number that is not used by another event.
4.
Select the Event Type. Select Single Day for a one-time event and select Date Range for events that take place during two or more days.
Note: If you select a single day, only the start date field is available under Event Date(s).
5.
6.
7.
Click Save.
Note: You cannot adjust the sales mix before saving the event thus far.
8.
Enter the expected increase or decrease in sales in the Increase/Decrease Menu Items by box in the Menu Items Affected section.
9.
Select Specific in the Menu Items Affected section, to have the event affect specific menu items or time intervals.
Note: When Specific is selected the Button_Sm-Search becomes available.
a)
Click search Button_Sm-Search to access the list of menu items to choose from.
b)
Select the menu items to be affected.
Tip: To select multiple items, press and hold the control key and click each item to add.
c)
Click Save to keep the selected items.
 
Click the search button Button_Sm-Search 
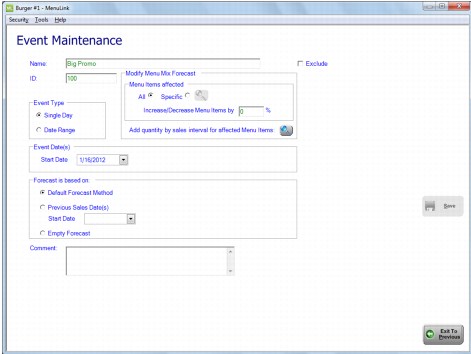
next to Add quantity by sales interval for affected Menu Items, to cause the event to affect specific time intervals.
a)
Select the sales date to modify.
b)
c)
d)
Click Save to keep your changes.
10.
Tip: When you create your forecast for a week that contains an event the following alert appears and displays the event name:
CL_FCast_EventsMessage
11.
Click Ok to finish.
 
Forecasting by Alternate Sales Types
The MenuLink Forecast Alternate Sales feature provides the ability to create forecasts based on different metrics than simply total sales or guest counts. This can provide more accurate information for a specific aspect of your site, such as Front-of-House (FOH) and Back-of-House (BOH). This new forecast separation also ties into specific Job Codes to more accurately recommend required staffing levels.
Note: If you would like to use this feature and it is not active in your system, please contact your MenuLink Administrator.
Viewing an Alternate Sales Type Forecast:
1.
Note: You can also access Forecasting through the Sales screen by clicking Forecasting.
 
2.

Forecast by Average using Alternate Sales type
1.
2.
Access the alternate sales type available by clicking the button on the right side of the Forecasting- Calculate Average screen. The label on the button reflects the type of sales available. Click this button to open the Forecasting- Calculate Average screen for the alternative sales type.
3.
4.
Click Save to keep your changes.


MenuLink Online Help
Copyright © 2012 Radiant Systems, Inc. All rights reserved.