From the Plots menu, DGF- DIF-DPF Plot 33 produces the plotted output corresponding to Table 33. It shows Differential Group Functioning (DGF) between classes of items and classes of persons.
The DGF dialog displays when Table 33 is called from the Output Tables or Plots menus.
There are six Excel plots. You have the full Excel capabilities to edit the plot, and the Excel worksheet contains the plotted numbers.
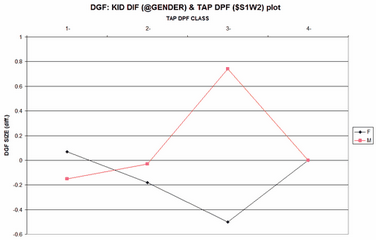
DGF SIZE (diff.)-ip = item-person |
reports the relative DGF difficulty size of the item classes as points and the person classes as columns |
DGF t-value (diff.)-ip |
tests the hypothesis that the DIF sizes can be attributed to chance: t-value = DGF size / DGF size S.E. This displays the item classes as points and the person classes as columns |
DGF Average Score-points-ip |
displays the average difference between the observed score and the expected score for each response on this item CLASS by this person CLASS |
DGF SIZE (diff.)-pi = person-item |
reports the relative DGF difficulty size of the person classes as points and the item classes as columns |
DGF t-value (diff.)-pi |
tests the hypothesis that the DIF sizes can be attributed to chance: t-value = DGF size / DGF size S.E. This displays the person classes as points and the item classes as columns |
DGF Average Score-points-pi |
displays the average difference between the observed response and the expected response for each person CLASS on each item CLASS |