PFILE=filename produces an output file containing the information for each person. This file contains 4 heading lines (unless HLINES=N), followed by one line for each item containing the following fields and the standard field selection. To change the output-field selection, go to the Output File dialog, PFILE=, Field selection, Make default.
PFILE=? opens a Browse window
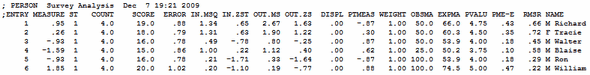
"Status=-2 to -6" means that there are no measurable responses by those persons in this analysis. The persons may be listed in the PFILE= and in Table 18, but all the numbers shown are default values. They have no meaning. Please do not include those persons in summary statistics.
Columns: |
with 'Select All" fields using Output File Field Selection |
|||
Start |
End |
Label |
Format |
Description |
1 |
1 |
|
A1 |
Blank or ";" if HLINES=Y and there are no responses or deleted or extreme (status =0,-1, -2, -3) |
2 |
6 |
ENTRY |
I5 |
1. The person sequence number |
7 |
14 |
MEASURE |
F8.2 |
2. Person's calibration (user-rescaled by UMEAN=, USCALE=, UDECIM=) |
15 |
17 |
STATUS |
I3 |
3. The person's status 3 = Anchored (fixed) measure with extreme (minimum or maximum) observed raw score 2 = Anchored (fixed) measure 1 = Estimated measure 0 = Extreme minimum measure (estimated using EXTRSC=) for extreme minimum raw score -1 = Extreme maximum measure (estimated using EXTRSC=) for extreme maximum raw score -2 = No responses available for measure -3 = Deleted by user -4 = Inestimable: high (all responses in the same category with ISGROUPS=0 or CUTHI=) -5 = Inestimable: low (all responses in the same category with ISGROUPS=0 or CUTLO=) -6 = Deselected |
18 |
25 |
COUNT |
F8.1 |
4. The number of responses used in calibrating (TOTAL=N), or the observed count (TOTAL=Y) |
26 |
34 |
SCORE |
F8.1 |
5. The raw score used in calibrating (TOTAL=N) or the observed score (TOTAL=Y) |
35 |
41 |
ERROR |
F7.2 |
6. Person calibration's standard error (user-rescaled by USCALE=, UDECIM=) |
42 |
48 |
IN.MSQ |
F7.2 |
7. Person infit: mean square infit |
49 |
55 |
ZSTD, ZEMP, LOG |
F7.2 |
8. Person infit: t standardized, locally t standardized, or log-scaled (LOCAL=) |
56 |
62 |
OUT.MS |
F7.2 |
9. Person outfit: mean square outfit |
63 |
69 |
ZSTD, ZEMP, LOG |
F7.2 |
10. Person outfit: t standardized, locally t standardized ,or log-scaled (LOCAL=) |
70 |
76 |
DISPLACE |
F7.2 |
11. Person displacement (user-rescaled by USCALE=, UDECIM=) |
77 |
83 |
PTBS, PTMEAS |
F7.2 |
12. Person by test-score correlation: point-biserial, or point-measure (PTBIS=) |
84 |
90 |
WEIGHT |
F7.2 |
13. Person weight (PWEIGHT=) |
91 |
96 |
OBSMA |
F6.1 |
14. Observed percent of observations matching prediction |
97 |
102 |
EXPMA |
F6.1 |
15. Expected percent of observations matching prediction |
103 |
108 |
PVALUE |
F6.2 |
16. P-value: proportion correct or average rating (PVALUE=) |
109 |
114 |
PME-E |
F6.2 |
17. Person by test-score correlation: expected value |
115 |
120 |
RMSR |
F6.2 |
18. RMSR: root-mean-square residual (RMSR=) |
121 |
121 |
|
1X |
Blank |
122 |
151+ |
NAME |
A30+ |
19. Person name |
The format descriptors are: |
||||
In = Integer field width n columns |
||||
Fn.m = Numeric field, n columns wide including n-m-1 integral places, a decimal point and m decimal places |
||||
An = Alphabetic field, n columns wide |
||||
nX = n blank columns. |
||||
When CSV=Y, commas separate the values, which are squeezed together without spaces between. Quotation marks surround the "Person name", e.g., 1,2,3,4,"Name". When CSV=T, the commas are replaced by tab characters.
When W300=Yes, then this is produced in Winsteps 3.00, 1/1/2000, format:
Columns: |
||||
Start |
End |
Label |
Format |
Description |
1 |
1 |
|
A1 |
Blank or ";" if HLINES=Y and there are no responses or deleted (status = -2, -3) |
2 |
6 |
ENTRY |
I5 |
1. The person sequence number |
7 |
14 |
MEASURE |
F8.2 |
2. Person's calibration (user-rescaled by UMEAN=, USCALE=, UDECIM) |
15 |
17 |
STATUS |
I3 |
3. The person's status: 3 = Anchored (fixed) measure with extreme (minimum or maximum) observed raw score 2 = Anchored (fixed) measure 1 = Estimated measure 0 = Extreme minimum (estimated using EXTRSC=) -1 = Extreme maximum (estimated using EXTRSC=) -2 = No responses available for measure -3 = Deleted by user -4 = Inestimable: high (all responses in the same category with ISGROUPS=0 or CUTHI=) -5 = Inestimable: low (all responses in the same category with ISGROUPS=0 or CUTLO=) -6 = Deselected |
18 |
23 |
COUNT |
I6 |
4. The number of responses used in measuring (TOTAL=N) or the observed count (TOTAL=Y) |
24 |
30 |
SCORE |
I6 |
5. The raw score used in calibrating (TOTAL=N) or the observed score (TOTAL=Y) |
31 |
37 |
ERROR |
F7.2 |
6. Person calibration's standard error (user-rescaled by USCALE=, UDECIM=) |
38 |
44 |
IN.MSQ |
F7.2 |
7. Person mean square infit |
45 |
51 |
ZSTD, ZEMP, LOG |
F7.2 |
8. Person infit: t standardized, locally t standardized, or log-scaled (LOCAL=) |
52 |
58 |
|
F7.2 |
9. Person mean square outfit (OUT.MS) |
59 |
65 |
ZSTD, ZEMP, LOG |
F7.2 |
10. Person outfit: t standardized, locally t standardized, or log-scaled (LOCAL=) |
66 |
72 |
DISPLACE |
F7.2 |
11. Person displacement (user-rescaled by USCALE=, UDECIM=) |
73 |
79 |
PTBS, PTME |
F7.2 |
12. Person by test-score correlation: point-biserial, or point-measure |
80 |
80 |
|
1X |
13. Blank |
81 |
112+ |
NAME |
A30+ |
14. Person name |
Example of standard PFILE=
Example: You wish to write a file on disk called "STUDENT-PF.txt" containing the person statistics for import later into a student information database:
PFILE=STUDENT-PF.txt