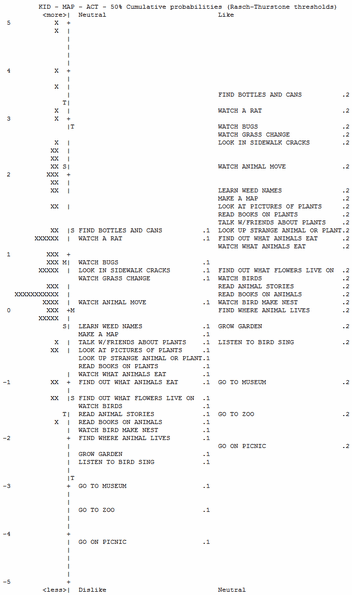
This Table is only produced for polytomies. It shows the items positioned at median 50% cumulative probability (the Rasch-Thurstone thresholds) at the lower edge of each rating probability zone. Above label.2, the most probable category is 2. Below label.1, the most probable category is 0. Between label.1 and label.2 is the zone which can be thought of as corresponding to a rating of 1. These correspond to the Cumulative Probability thresholds.
If you put the item number at the start of the item labels after &END, you can show only the item numbers on this plot by using NAMLMP= or IMAP=. Columns are headed by the (rescored) categories in CFILE=.
Where there are more items than can be shown on one line, the extra items are printed on subsequent lines, but the latent variable "|" does not advance and is left blank. The plotted values are in the ISFILE=.
.