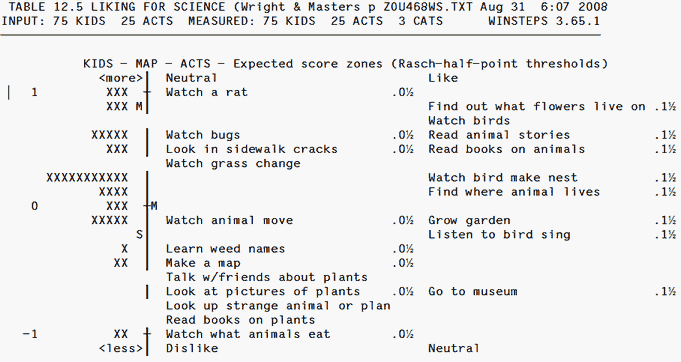
This Table is only produced for polytomies. It shows the items positioned at the lower edge of each expected score zone (the half-point thresholds). The expected score zone above "item-label .2½" extends from expected category score 2.5 to 3.5. Lower than "item-label.0½" is the zone from 0 to 0.5. These correspond to the thresholds on the Expected Score ICC.
If you put the item number at the start of the item labels after &END, you can show only the item numbers on this plot by using NAMLMP= or IMAP=.
Column headings are the category labels that match the (rescored) category numbers in CFILE= or CLFILE=.
Where there are more items than can be shown on one line, the extra items are printed on subsequent lines, but the latent variable "|" does not advance and is left blank. The plotted values are in the ISFILE=.

The half-point thresholds are indicated by .n½ when ASCII=No or ASCII=Web, or .n5 when ASCII=Yes