(controlled by LINELENGTH=, MRANGE=, MAXPAGE=, NAMLMP=, ISORT=, PSORT=. There are more options at TFILE=)
Table 1.0 is printed, if person and item maps can be squeezed into one page. You can use NAMLMP= to limit the number of characters of each name reported. LINELENGTH= changes the available space on the line. MAXPAGE= controls the length of the Table. MRANGE= controls the displayed range of measures. ISORT= and PSORT= control the sort order within rows.
Table 1:
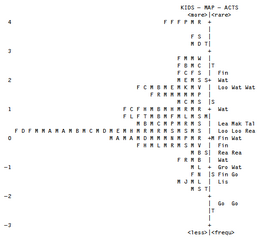
1.1 Map of distributions - persons and items
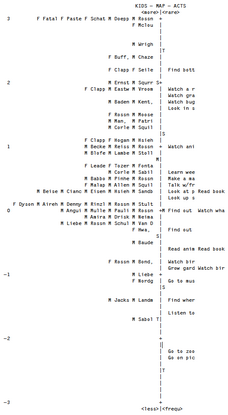
1.2 Item labels with person distribution (squeezed onto one page)
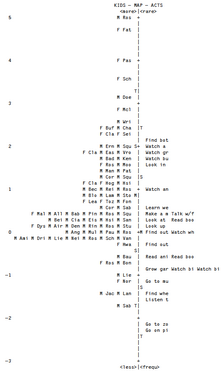
1.3 Person labels with item distribution (squeezed onto one page)
1.4 Rating scale or partial credit map of distributions: persons with items at high, mean, low
1.10 One page map with person names by measure, item names by easiness.
1.12 Item labels, by easiness, with person distribution (squeezed onto one page)
For the full person labels, please use Table 16.
For the full item labels, please use Table 12.
"TSMST" summarize the left-hard and right-hand distributions. An "M" marker represents the location of the mean measure. "S" markers are placed one sample standard deviation away from the mean. "T" markers are placed two sample standard deviations away.
Get the map to look how you want on your screen by adjusting font sizes, type faces, MRANGE=, MAXPAGE=, etc., then use your PrintScreen key to make a copy of the screen. Paste into Word, PowerPoint, etc.
These Tables can be copied-and-pasted into Excel spreadsheets, and then Excel "Text to columns" used to beautify the output. A more elaborate procedure is at Excel item map.
Items arranged by measure: Look for the hierarchy of item names to spell out a meaningful construct from easiest at the bottom to hardest at the top.
Example 1. Standard display.
MAXPAGE = 0 ; default page length
MRANGE = 0 ; range controlled by the measures
Example 2. Symmetric display around the item mean.
MAXPAGE = 0 ; default page length
MRANGE = -3 ; range away from item mean controlled by analyst.
Example 3. Custom display.
MAXPAGE=50 ; pre-set page length
TFILE=* ; in the control file
1 -3 4 ; Table 1 with display from -3 to +4 logits.
*