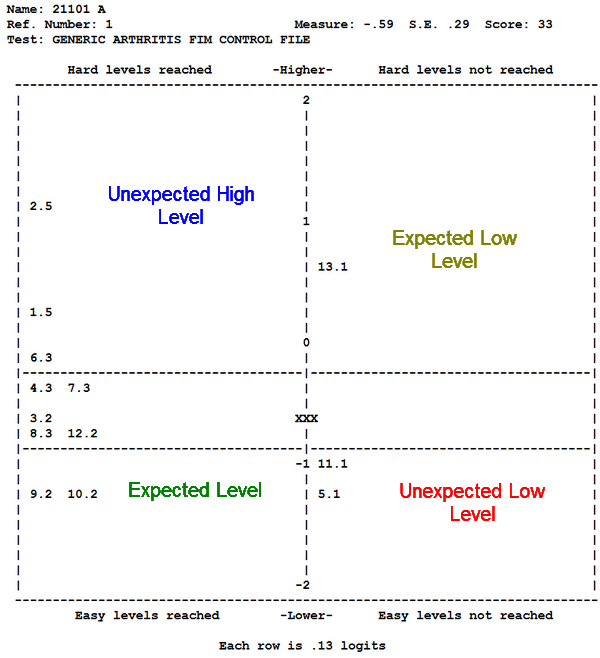
PKMAP diagnostic maps are a means of displaying the responses of a person to the items. They are described in KIDMAP: Person-by-Item Interaction Mapping.
For dichotomies, text output:
MAXPAGE=40
ASCII=No
*

For dichotomies, webpage output, with automatic page-breaks when printed:
MAXPAGE=40
ASCII=Webpage
*

For polytomies:
Continuation lines:
When there are too many item numbers to fit on one line, they are continued on the next line, indicated by ":"
![]()
What observation goes where:
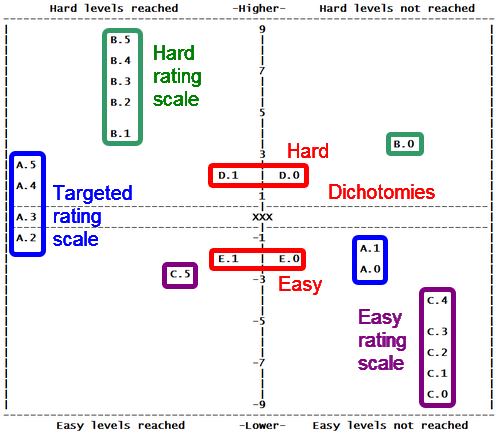
This Figure (using the Lucida Console font) shows the location in a PKMAP of every possible response to 6-category (0-5) rating-scale items A, B, C and two-category (0-1) dichotomous items, D, E, by a person of 0 logits ability.
PKMAP= customization
|
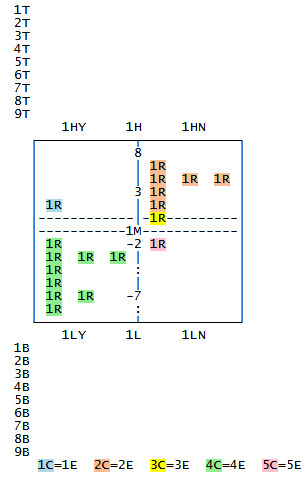
Figure: PKMAP field numbers and positions
Format in Winsteps control file:
PKMAP=* ; inline instructions for the PKMAP output in Table 36
(Field number)= value
....
*
Format in text file:
use Edit menu
Edit/Create file with NOTEPAD to modify these settings.
In text file, for example:
1D = Yes
Save text file as MyPKMAP.txt in the same folder as the Control file
Specification menu: PKMAP = MyPKMAP.txt
Field code |
Values |
Meaning |
1T-9T = Top headings 1HY, 1H, 1HN = High side of grid 1M = Measure = Middle (ability) 1LY, 1L , 1LN = Low side of grid 1B-9B = Bottom footers 1E-5E = Color explanations |
(blank) |
do not display the field |
\ |
blank line |
|
text |
display the text in the field location |
|
#nnn# (can be included in text) |
display the statistic in the field location |
|
1R = Response = Rating |
(blank) or text or #nnn# #CODE# #CAT# |
(as above) Response code in the data file Scored category number |
1G = Grid for PKMAP layout |
Top left cell of grid is: HY High measure, Yes reached HN High measure, Not reached LY Low measure, Yes reached LN Low measure, Not reached |
Controls layout of the PKMAP by identifying the top left quadrant |
1C-5C = Color codes |
HTML color codes, e.g., lightgreen #E7C4A3 |
The color codes for text in the grid cells: 1C = High Yes (Current level) 2C = High No (Next level) 3C = 50-50 4C = Low Yes (Current level) 5C = Low No (Next level) |
1P = Placement of response |
T = Rasch-Thurstone 50% threshold H or F = Half-point and Full-point thresholds |
Vertical measure at which to place a response. |
1D = Display all the field numbers |
"Y" = Display field numbers and values at start of output |
The field codes and their values |
1F = Minimum mean-square to report |
0 = all mean-squares 1.5 = only persons with infit or outfit mean-squares greater than 1.5 are reported |
Selects only Kidmaps for misfitting response strings |
1S = Sort instructions |
n = Entry number descending N = Entry number ascending m = Measure descending M = Measure ascending f = Mean-square fit descending F = Mean-square fit ascending fI, FI = use Infit mean-square a = Alphabetical llabel descending A = Alphabetical label ascending |
Order of the PKMAP Kidmaps in the output table. |
Field number not in PKMAP= list |
none |
(ignored) |
Control variable= PSELECT=???A ; selection PDELETE=(list of entry numbers) PDFILE=(file of entry numbers) ASCII=Webpage |
value |
control variable for the PKMAP display |
T36 |
- |
output the Table 36 PKMAPs |
#nnn# |
Value: 1=-8= Person. 9= Item |
#NAME# or #LABEL# |
Name or label |
#ENTRY# |
Entry number |
#MEASURE# |
|
#COUNT# |
Total number of scored responses |
#SCORE# |
Total raw score |
#ERROR# |
Standard error of measure (user-rescaled by USCALE=, UDECIM=) |
#INMNSQ# |
Infit mean-square |
#INZSTD# |
Standardized Infit statistic: t standardized, locally t standardized, or log-scaled (LOCAL=) |
#OUTMNSQ# |
Outfit mean-square |
#OUTZSTD# |
Standardized Outfit statistic: t standardized, locally t standardized, or log-scaled (LOCAL=) |
#TITLE# |
TITLE= of this analysis |
#Y# |
Measure-units for each row (line) advance on vertical y-axis. |
Display the label substring |
|
## |
# |
#CENTER# |
Center this field (1T-9T and 1B-9B only) |
PKMAP= default values for dichotomies (True/False, Multiple-Choice)
PKMAP = *
1D = "No"
1F = "0"
1S = "N"
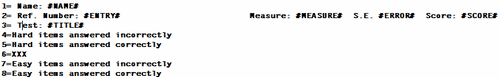
1T = " Name: #NAME#"
2T = " Ref. Number: #ENTRY# Measure: #MEASURE# S.E. #ERROR# Score: #SCORE#"
3T = " Test: #TITLE#"
4T = "\"
1G = "HY"
1P = "Half-point threshold"
1R = "#ENTRY#.#CAT#"
1HY = "Hard items answered correctly"
1H = "\<b\>\<i\>-Harder-\</b\>\</i\>"
1HN = "Hard items answered incorrectly"
1M = "\<FONT COLOR="RED"\>XXX\</FONT\>"
1LY = "Easy items answered correctly"
1L = "\<b\>\<i\>-Easier-\</b\>\</i\>"
1LN = "Easy items answered incorrectly"
1B = "\"
2B = "#CENTER#Each row is #Y# logits"
3B = "\"
1E = "\<SPAN CLASS=1C\>blue\</SPAN\>=Unexpected Yes."
2E = " \<SPAN CLASS=2C\>orange\</SPAN\>=No."
3E = " \<SPAN CLASS=3C\>yellow\</SPAN\>=50/50."
4E = " \<SPAN CLASS=4C\>green\</SPAN\>=Yes."
5E = " \<SPAN CLASS=5C\>pink\</SPAN\>=Unexpected No."
1C = "lightblue"
2C = "#FFBD91"
3C = "yellow"
4C = "lightgreen"
5C = "pink"
; = = = "default values above. User-set values below."
*
PKMAP= default values for polytomies (Rating Scale, Partial Credit)
PKMAP = *
1D = "No"
1F = "0"
1S = "N"
1T = " Name: #NAME#"
2T = " Ref. Number: #ENTRY# Measure: #MEASURE# S.E. #ERROR# Score: #SCORE#"
3T = " Test: #TITLE#"
4T = "\"
1G = "HY"
1P = "Full-point threshold"
1R = "#ENTRY#.#CODE#"
1HY = "Hard levels reached"
1H = "\<b\>\<i\>-Higher-\</b\>\</i\>"
1HN = "Hard levels not reached"
1M = "\<FONT COLOR="RED"\>XXX\</FONT\>"
1LY = "Easy levels reached"
1L = "\<b\>\<i\>-Lower-\</b\>\</i\>"
1LN = "Easy levels not reached"
1B = "\"
2B = "#CENTER#Each row is #Y# logits"
3B = "\"
1E = "\<SPAN CLASS=1C\>blue\</SPAN\>=Unexpected Yes."
2E = " \<SPAN CLASS=2C\>orange\</SPAN\>=No."
3E = " \<SPAN CLASS=3C\>yellow\</SPAN\>=50/50."
4E = " \<SPAN CLASS=4C\>green\</SPAN\>=Yes."
5E = " \<SPAN CLASS=5C\>pink\</SPAN\>=Unexpected No."
1C = "lightblue"
2C = "#FFBD91"
3C = "yellow"
4C = "lightgreen"
5C = "pink"
; = = = "default values above. User-set values below."
*
HTML codes can be used with \< and \> replacing < and >. HTML codes are ignored for text output.
Color: \<font color=red\>....\</font\> for HTML colors
or \<span class=1C\>....\</span\> for the colors defined in 1C, 2C, 3C, 4C, 5C
A list of color names is shown at http://www.w3schools.com/html/html_colornames.asp - Hex values can also be used. These color names and hex values are used for 1C-5C.
Bold: \<b\>...\</b\> but bold for 1M and 1R may cause misalignment. Use a color instead.
Italic: \<i\>...\</i\> but bold for 1M and 1R may cause misalignment. Use a color instead.
PKMAP Size
The internal height of PKMAP grid box is 61 or MAXPAG= value - 8.
The internal width of the PKMAP grid box is LINELENGTH= value - 6.
PKMAP page breaks
Each diagnostic map automatically starts on a new page when Table 36 is output as a webpage (ASCII=W) or as a Word document (ASCII=D).
Adjusting PKMAP wording
| 1. | With the current PKMAP settings, "Output Tables" menu. Table 36. To list the settings at the start of Table 36, include in your control file: PKMAP=* 1D = Yes * |
| 2. | Table 36 processing may be interrupted with Ctrl+F. |
![]()
| 3. | Copy the PKMAP instructions from Table 36 into a new text file. |
| 4. | Edit the PKMAP instructions in the new file |
| 5. | Save the new file |
| 6. | Specification box: PKMAP=? |
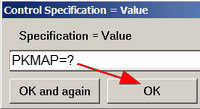
| 7. | A file dialog box displays. Navigate to the new file. Then click OK. |
| 8. | "Output Tables" menu. Table 36. Again .... |
Questions:
1. Can I select cases, e.g., all cases with infit and outfit > 1.33? Very important to diagnose potential atypical cases.
Reply: Include in your PKMAP= file:
1F = 1.33
You wrote:
2. Can I select a particular person, e.g., #123 is interesting because of misfit on infit and outfit?
Reply:
Winsteps specification menu box: PDELETE=+123
Output Table 36
Winsteps specification menu box: PDELETE=
You wrote: Select on other criteria, e.g., age, gender?
Windows specification menu box:
PSELECT=??????M
3. Can I display the item labels instead of just the item entry numbers on the map?
Reply: Include in your PKMAP= file:
1R = #LABEL#
or, if you only want part of the label:
1R =#$S3E5$# ; for colums 3,4,5 in the item label
4. It does not appear that all cases get PKMAPs, do they? How are the persons selected?
Reply:
Usually everyone has a PKMAP. Your control file or PKMAP= file contains a PSELECT= or PDELETE= instruction. This deletes some people.