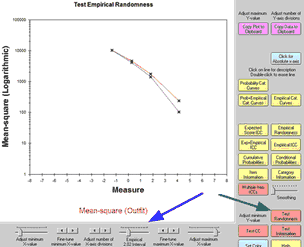
Select by clicking on "Test Randomness" or from the Graphs menu. Empirical intervals are set with the "Empirical Interval" slider. This displays the local value of the mean-square statistics. The Outfit mean-square statistic (standardized residual chi-square divided by its degrees of freedom) is the red line. The Infit mean-square statistic (ratio of observed to expected residual variance) is the blue line.
Buttons are described in Graph window.