From the Plots menu, Bubble charts show measures and fit values graphically. They are featured in Bond & Fox. For successful operation, Excel must be available on your computer. Its maximum is 65,536 rows.
To produce these charts, Winsteps writes out the requisite values into a temporary file. Excel is then launched automatically. It reads in the temporary file and follows instructions to create a bubble plot. The plot is displayed, and the Excel worksheet becomes available for any alterations that are desired. The Excel worksheet may be made permanent using "Save As". The free Excel Add-in XY Chart Labeler from http://www.appspro.com/Utilities/ChartLabeler.htm is useful if your want to change the bubble labels.
Selecting "Bubble Chart" from the Plots menu:
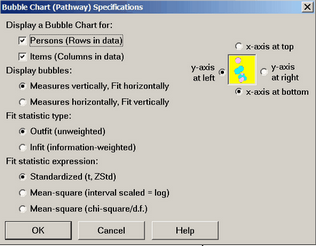
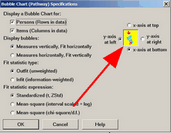
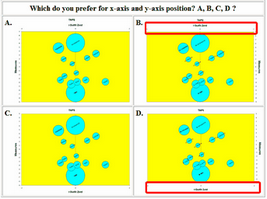
1. Positioning the axes and labels: use the dialog box, or right-click on the axes and axes-titles to reposition them.
|
|
Bubble Resizing: The relative bubble sizes are set by the standard errors. of the measures. But their overall absolute size is set by Excel. To change their overall sizes, Right click on the edge of a circle. "Format Data Series" "Options" "Scale bubble size to:" If the bubbles are roughly the same size, then their measures will be significantly different (p<.05) if they do not overlap along the measure axis when the bubble radius is 1.96 * 1.414 * S.E. / 2 = 1.4 * S.E. Please determine the actual bubble resizing by comparing the bubble size to the measure-axis scaling. |
|
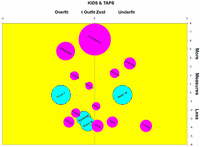
Bubbles showing Likert categories: Likert data is shown in vertical bubbles -- such in Bond and Fox (2007) Fig 6.2 p.104 -- but this is not yet produced by Winsteps automatically. Please produce an item bubble-chart. Then, in its Excel worksheet, edit in extra lines for each item. Use values from ISFILE= for the item difficulties. |
|

Autoshape the bubbles: Excel 2007 and later: Let us change the shapes of the bubbles for persons and items.
This may take several attempts to produce the bubbles you want. |
|
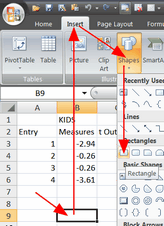
In Excel 2007, Excel 2007.
In your worksheet,
Click on an empty cell
Insert Rectangle |
|
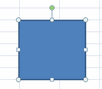
Drag your mouse to draw a square |
|
Insert Rectangle (or any other shape)
Drag your mouse to draw a square inside the other square
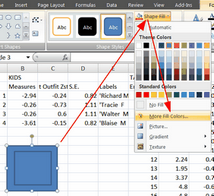
Right-click the new square Format Shape Fill Color (your choice of color) |
|
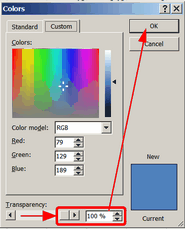
2. Click on the outer square to select it. Shape fill More fill colors
|
|
"Colors" Transparency 100% OK |
|
Right-click on box Format shape Line color No line (the box disappears) |
|
Click on one box ctrl+click on the other box ctrl+c to copy |
|
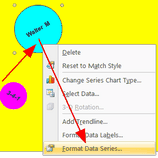
On the bubble chart Right-click a child bubble Format data series |
|
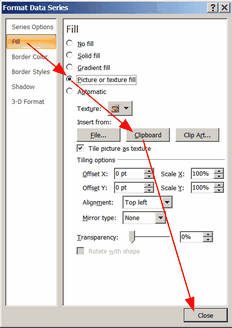
Format Data Series Fill Picture Clipboard Close
The bubbles should now look like your colored rectangle. |
|
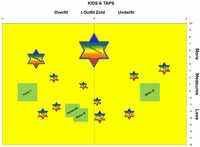
This is a little more creative, using Star shapes and gradient-color fill. |
|