(controlled by USCALE=, UMEAN=, UDECIM=, LOCAL=, TOTAL=)
Table
18.2 Chart of person measures, infit mean-squares and outfit mean-squares. (Chart=Yes)
18.3-... KeyForms of responses of persons.
PERSON STATISTICS: ENTRY ORDER
Above the Table are shown the "real" separation coefficient and reliability (separation index) coefficients from Table 3.
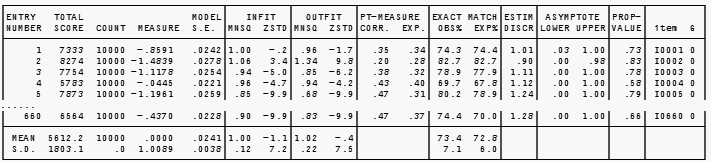
ENTRY NUMBER is the sequence number of the person, or item, in your data, and is the reference number used for deletion or anchoring.
STATUS (the Code is shown in PFILE= and IFILE=)
Reported |
Code |
Measured? |
Reason |
A (after Measure) |
3 |
Yes |
Anchored (fixed) measure with extreme (minimum or maximum) observed raw score |
A (after Measure) |
2 |
Yes |
Anchored (fixed) measure |
(Measured) |
1 |
Yes |
Estimated measure |
MINIMUM |
0 |
Yes |
Extreme minimum (estimated using EXTRSC=) |
MAXIMUM |
-1 |
Yes |
Extreme maximum (estimated using EXTRSC=) |
DROPPED |
-2 |
No |
No responses available for measure. Perhaps due to CUTLO=, CUTHI=, CODES=, or deletion |
DELETED |
-3 |
No |
|
INESTIMABLE: HIGH |
-4 |
No |
Inestimable: high (all responses in the same category with ISGROUPS=0 or CUTHI=) |
INESTIMABLE: LOW |
-5 |
No |
Inestimable: low (all responses in the same category with ISGROUPS=0 or CUTLO=) |
DESELECTED |
-6 |
No |
Deselected (ISELECT=, PSELECT=, IDELETE=, PDELETE=) from the "Specifications" dialog box |
TOTAL SCORE or RAW SCORE is the raw score corresponding to the parameter, i.e., the raw score by a person on the test, or the sum of the scored responses to an item by the persons. Totalscore=Yes to include all responses. Totalscore=No to omit responses in extreme scores.
COUNT is the number of data points used to construct measures. Totalscore=Yes to include all responses. Totalscore=No to omit responses in extreme scores.
MEASURE is the estimate (or calibration) for the parameter, i.e., person ability (theta, B, beta, etc.), or the item difficulty (b, D, delta, etc.). Values are reported in logits with two decimal places, unless rescaled by USCALE=, UIMEAN=, UPMEAN=, UDECIM=. If the score is extreme, a value is estimated, but as MAXIMUM (perfect score) or MINIMUM (zero score). No measure is reported if the element is DROPPED (no valid observations remaining) or DELETED (you deleted the person or item). The difficulty of an item is defined to be the point on the latent variable at which its high and low categories are equally probable. SAFILE= can be used to alter this definition.
If unexpected results are reported, check whether TARGET= or CUTLO= or CUTHI= or ISGROUPS= are specified.
INESTIMABLE is reported if all observations are eliminated as forming part of extreme response strings.
MODEL S.E. is the standard error of the estimate. REAL S.E. is the misfit-inflated standard error. These are commonly referred to as conditional standard errors of measurement (CSEM).
A for anchored values. "A" is shown on the listing and the error reported is that which would have been obtained if the value had been estimated. Values are reported in logits with two decimal places, unless rescaled by USCALE=, UDECIM=
INFIT is a t standardized information-weighted mean square statistic, which is more sensitive to unexpected behavior affecting responses to items near the person's measure level.
OUTFIT is a t standardized outlier-sensitive mean square fit statistic, more sensitive to unexpected behavior by persons on items far from the person's measure level.
MNSQ is the mean-square infit or outfit statistic with expectation 1. Values substantially less than 1 indicate dependency in your data; values substantially greater than 1 indicate noise. See dichotomous and polytomous fit statistics.
Value |
Meaning |
>2.0 |
Off-variable noise is greater than useful information. Degrades measurement. Always remedy the large misfits first. |
>1.5 |
Noticeable off-variable noise. Neither constructs nor degrades measurement |
0.5 - 1.5 |
Productive of measurement |
<0.5 |
Overly predictable. Misleads us into thinking we are measuring better than we really are. (Attenuation paradox.). Misfits <1.0 are only of concern when shortening a test |
ZSTD is the infit or outfit mean-square fit statistic t standardized to approximate a theoretical "unit normal", mean 0 and variance 1, distribution. ZSTD (standardized as a z-score) is used of a t-test result when either the t-test value has effectively infinite degrees of freedom (i.e., approximates a unit normal value) or the Student's t-statistic distribution value has been adjusted to a unit normal value. The standardization is shown on RSA, p.100-101. When LOCAL=Y, then ZEMP is shown, indicating a local {0,1} standardization. When LOCAL=LOG, then LOG is shown, and the natural logarithms of the mean-squares are reported. More exact values are shown in the Output Files.
Ben Wright advises: "ZSTD is only useful to salvage non-significant MNSQ>1.5, when sample size is small or test length is short."
PT-MEASURE CORR. (reported when PTBISERIAL=N) is the point-measure correlation, rpm or RPM, between the observations on an item (as fractions with the range 0,1) and the corresponding person measures, or vice-versa. Since the point-biserial loses its meaning in the presence of missing data, specify PTBISERIAL=N when there are missing data or when CUTLO= or CUTHI= are specified. The point-measure correlation has a range of -1 to +1.
PT-BISERIAL CORR (reported when PTBISERIAL=Yes) or PTBSA CORR (reported when PTBISERIAL=All) is the point-biserial (or point-polyserial) correlation, rpbis, between the individual item (or person) response "scores" and the total person (or item) test score (less the individual response "scores"). Negative values for items often indicate mis-scoring, or rating (or partial credit) scale items with reversed direction. Letters indicating the identity of persons or items appearing on the fit plots appear under PTBSE. For adaptive tests, an rpbis near zero is expected. See Correlations.
EXP. is the expected value of the correlation when the data fit the Rasch model with the estimated measures.
EXACT MATCH
OBS% Observed% is the percent of data points which are within 0.5 score points of their expected values, i.e., that match predictions.
EXP% Expected% is the percent of data points that are predicted to be within 0.5 score points of their expected values.
ESTIM DISCRIM is an estimate of the item discrimination, see DISCRIM=
ASYMPTOTE LOWER and UPPER are estimates of the upper and lower asymptotes for dichotomous items, see ASYMPTOTE=
PROP-VALUE is the proportion-correct (p-value) or average rating on the item.
RMSR is the root-mean-square-residuaL of observations not in extreme scores, see RMSR=.
WEIGH is the weight assigned by IWEIGHT= or PWEIGHT=
DISPLACE is the displacement of the reported MEASURE from its data-derived value. This should only be shown with anchored measures. The displacement values can be see in IFILE= and PFILE= output files.
The displacement is an estimate of the amount to add to the MEASURE to make it conform with the data.
+1 logit displacement for a person ability indicates that the observed person score is higher than the expected person score based on the reported measure (anchor value).
+1 logit displacement for an item difficulty indicates that the observed item score is lower than the expected item score based on the reported measure (anchor value).
Unanchored measures: If small displacements are being shown, try tightening the convergence criteria, LCONV=.
Anchored measures: we expect half the displacements to be negative and half to be positive, and for them to be normally distributed according to the standard errors of the measures.
Item is the name of the list of persons (data rows) or items (data columns) reported here
I0001 (Label) is the person or item label.
G is the grouping code assigned with ISGROUPS=
M is the model code assigned with MODELS=
Above the Table are shown the "real" separation and reliability coefficients from Table 3.
If SUBSET: appears, see Subsets.