If XFILE=filename is specified in the control file, a file is output which enables a detailed analysis of individual response anomalies.
XFILE=? opens a Browse window
This file contains 4 heading lines (unless HLINES=N) followed by one line for each person-by-item response used in the estimation. Each line contains:
Field number |
Description |
Number Format |
Abbreviation |
1 |
Person number |
7.0 |
PERSON |
2 |
Item number |
7.0 |
ITEM |
3 |
Original response value (after scoring with KEY=, IVALUE=,etc.) |
4.0 |
OBS |
4 |
Observed response value (OBS value after internal rescoring. This usually only happens for rating scales with unobserved intermediate categories and with STKEEP=NO.) |
4.0 |
ORD |
5 |
Expected response value This is computed from the measures without correction by STBIAS= If you want to see the values with STBIAS=YES, then: 1. Perform the analysis with STBIAS=YES 2. Output IFILE=if.txt PFILE=PF.txt SFILE=sf.txt 3. Perform the analysis again with STBIAS=NO IAFILE=if.txt PAFILE=pf.txt SAFILE=sf.txt |
7.3 |
EXPECT |
6 |
Modeled Variance of observed values around the expected value This is also the statistical information in the observation. Square root (modeled variance) is the observation's raw-score standard deviation |
7.3 |
VARIAN |
7 |
Standardized residual: (Observed - Expected)/Square root (Variance) This approximates a unit-normal deviate. Values outside ±2 are unexpected. |
7.3 |
ZSCORE |
8 |
Score residual: (Observed - Expected) |
7.3 |
RESIDL |
9 |
Person measure in USCALE= units |
7.2* |
PERMEA |
10 |
Item measure in USCALE= units |
7.2* |
ITMMEA |
11 |
Measure difference (Person measure - Item measure) in USCALE= units |
7.2* |
MEASDF |
12 |
Log-Probability of observed response |
7.3 |
L-PROB |
13 |
Predicted person measure from this response alone in USCALE= units |
7.2* |
PPMEAS |
14 |
Predicted item measure from this response alone in USCALE= units |
7.2* |
PIMEAS |
15 |
Modeled Kurtosis of the observed values around their expectation |
7.3 |
KURT |
16 |
More Probable of the Responses to be observed |
4.0 |
MPR |
17 |
Response code in data file |
A |
CODE |
18 |
Person label |
A |
PLABEL |
19 |
Item label |
A |
ILABEL |
7.3 means "7 columns with 3 decimal places". 2* means decimal places set by the XFILE= dialog box from the Output Files menu A means character field |
|||
Fields can be selected interactively, see below.
If CSV=Y, the values are separated by commas. When CSV=T, the commas are replaced by tab characters. For "non-numeric values in quotation marks", specify QUOTED=Y.
This file enables a detailed analysis of individual response anomalies. The response residual can be analyzed in three forms:
1) in response-level score units, from [(observed value - expected value)].
2) in logits, from [(observed value - expected value)/variance].
3) in standard units, [(observed value - expected value)/(square root of variance)].
The log-probabilities can be summed to construct log-likelihood and chi-square tests. Asymptotically, "chi-square = -2*log-likelihood".
Predicted person measure: Imagine that this observation was the only observation made for the person ... this value is the measure we would predict for that person given the item measure.
Predicted item measure: Imagine that this observation is the only observation made for this item ... this value is the measure we would predict for that item given the person measure.
The formulas are the same as for a response string of more than 1 observation. For dichotomies, see www.rasch.org/rmt/rmt102t.htm and for polytomies www.rasch.org/rmt/rmt122q.htm
Example: You wish to write a file on disk called "MYDATA.XF" containing response-level information for use in examining particularly response patterns:
XFILE=MYDATA.XF
Example: You wish to compute differential item functioning, DIF, for a specific classification group of people:
If Table 30 is not suitable, here is a simple approximation:
Since one item does not have enough information to measure a person, for item bias we have to do it on the basis of a classification group of people.
From the XFILE,
add the "score residuals" (not standardized) for everyone in classification "A" on a particular item.
Add the "modeled variance" for everyone in the classification.
Divide the residual sum by the variance sum. This gives an estimate of the DIF for classification "A" relative to the grand mean measure.
Do the same for classification "B" on the same item.
To contrast classification "A" with classification "B" then
DIF size "AB" =DIF estimate for "A" - DIF estimate for "B"
A significance t-test is t =DIF size "AB" / square root ( 1/variance sum for classification A + 1/variance sum for classification B))
When called from the "Output Files menu", you can select what fields to include in the file. And you can also specify particular persons and/or items. If this is too big for your screen see Display too big.
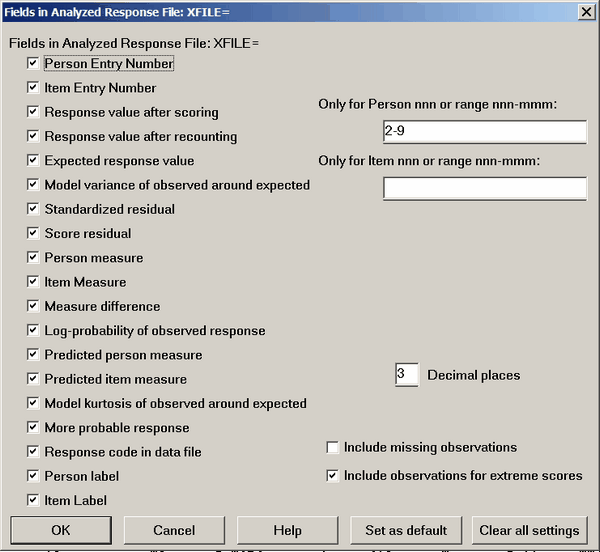
Only for Person (Item) nnn or range nnn-mmm: this allows selection of particular items and persons.
Example: "4 11-13 6 20-23" will list those persons in that order.
Decimal places controls the number of decimal places in the output file.