Table
20.2 Table of measures for every score, with sample percentiles and norm-referenced measures.
20.3 Table of item difficulty measures (calibrations) for every score (proportion-correct-values or average ratings) by complete sample.
Table 20 contains the measure and model standard error corresponding to every possible score on a test consisting of all the non-extreme items.
If you want the score file for person measures including the extreme (zero, perfect) items, then
1. Run a standard analysis.
2. Output: IFILE=if.txt SFILE=sf.txt
3. Run the analysis again, with Extra specifications: IAFILE=if.txt SAFILE=sf.txt
4. The person measures will have altered somewhat to adjust for the imputed difficulties of the extreme items.
5. Output Table 20 and SCOREFILE=
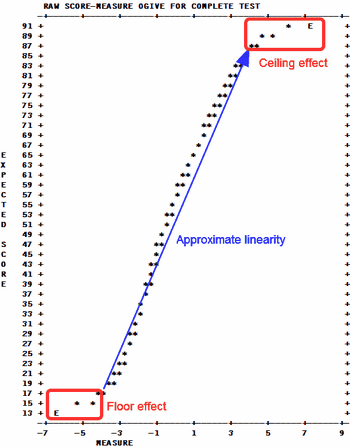
A measure and standard error is estimated for every possible score on a test composed of all non-extreme items included in the analysis. This can also be written with SCOREFILE=. The measures corresponding to extreme scores (all items right, or all items wrong) are marked by "E" and estimated using the EXTRSC= criterion. A graph of the score to measure conversion is also reported. '*' indicates the conversion. Since the 'S' and 'F' models specify that not all item levels are encountered, measures complete tests are only approximated here. If there are subsets, then the reported Table 20 is one of an infinite number of possible Table 20s. In the Table of Measures on Complete Test:
SCORE raw score on a complete test containing all calibrated items.
MEASURE measure corresponding to score. The convergence criterion used are (LCONV=)*.01 and (RCONV=)*.01 - these are considerably tighter than for the main analysis. So Table 20 is a more precise estimate of the person measures based on the final set of item difficulties. If STBIAS=YES is used, then score table measures are dependent on the data array, even if items are anchored.
"E" is a warning that the accompanying value is not estimated in the usual way, but is an approximation based on arbitrary decisions. For extreme scores, the Rasch estimated would be infinite. So the arbitrary decision has been made to make the extreme score more central by the EXTREMESCORE= amount (or its default value), and to report the measure corresponding to that score. The Rasch standard error of an extreme score is also infinite, so the reported standard error is the standard error of the reported measure.
S.E. standard error of the measure (model).
Table 20.1 gives the score-to-measure conversion for a complete test, when going from the y-axis (score) to the x-axis (measure). When going from the x-axis (measure) to the y-axis(score), it predicts what score on the complete test is expected to be observed for any particular measure on the x-axis. For CAT tests and the like, no one takes the complete test, so going from the y-axis to the x-axis does not apply. But going from the x-axis to the y-axis predicts what the raw score on the complete bank would have been, i.e., the expected total score, if the whole bank had been administered.
Score-to-measure tables for subtests can be produced by using ISELECT= or IDELETE= before requesting Table 20.
TABLE OF MEASURES ON TEST OF 13 ITEM
----------------------------------------------------------------------------
| SCORE MEASURE S.E. | SCORE MEASURE S.E. | SCORE MEASURE S.E. |
|------------------------+------------------------+------------------------|
| 13 -6.34E 1.82 | 40 -1.35 .28 | 67 1.33 .35 |
| 14 -5.15 .99 | 41 -1.27 .28 | 68 1.46 .36 |
....
| 36 -1.65 .28 | 63 .84 .35 | 90 6.04 1.03 |
| 37 -1.58 .28 | 64 .96 .35 | 91 7.29E 1.84 |
| 38 -1.50 .28 | 65 1.08 .35 | |
| 39 -1.43 .28 | 66 1.21 .35 | |
----------------------------------------------------------------------------
CURRENT VALUES, UMEAN=.0000 USCALE=1.0000
TO SET MEASURE RANGE AS 0-100, UMEAN=46.5329 USCALE=7.3389
TO SET MEASURE RANGE TO MATCH RAW SCORE RANGE, UMEAN=49.2956 USCALE=5.7243
Predicting Score from Measure: Score = Measure * 8.2680 + 38.9511
Predicting Measure from Score: Measure = Score * .1158 + -4.5099
This sub-table shows the person measures for every raw score on the complete set of items. It also suggests UMEAN= and USCALE= values for transformation of the measures into user-friendly values.
1
PERSON 1 1123 55247311 6 35411272 12
T S M S T
%TILE 0 10 20 40 50 60 70 80 90 99
ITEM 1 141221 1
T S M S T
%TILE 0 10 60 90 99
Measure distributions for the persons and items are shown below the score-to-measure table. M is the mean, S is one S.D. from the mean. T is two S.D.s from the mean. %ILE is the percentile, the percentage below the measure.
The statistical information is (USCALE/S.E.)² For the test information function, plot (USCALE/S.E.)² against the "MEASURE" or the "SCORE". The plot can be drawn with EXCEL. It is easier to obtain the information directly from the SCOREFILE=.
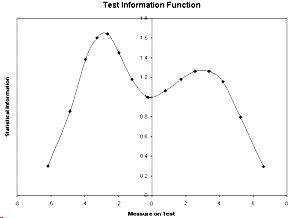
Table 20 shows integer raw scores, unless there are decimal weights for IWEIGHT=. In which case, scores to 1 decimal place are shown.
To obtain other decimal raw scores for short tests, go to the Graphs pull-down menu. Select "Test Characteristic Curve". This displays the score-to-measure ogive. Click on "Copy data to clipboard". Open Excel. Paste. There will be to three columns. The second column is the measure, the third column is the raw score.
Score-to-measure Table 20 can be produced from known item measures (IFILE=) and, for polytomies, known rating scale structure difficulties (SFILE=).
IAFILE=if.txt ; values from IFILE=if.txt ; the item anchor file
SAFILE=sf.txt ; values from SFILE=sf.txt ; the structure/step anchor file (if not dichotomies)
CONVERGE=L ; only logit change is used for convergence
LCONV=0.0001 ; logit change too small to appear on any report.
STBIAS=NO ; no estimation bias correction with anchor values
The data file comprises two dummy data records, so that every item has a non extreme score, e.g.,
For dichotomies:
CODES = 01
Record 1: 10101010101
Record 2: 01010101010
For a rating scale from 1 to 5:
CODES = 12345
Record 1: 15151515151
Record 2: 51515151515