How to run a DIF analysis
| 1. | Put a classification-group in the person label. In Exam1.txt this "M" or "F" in column 9 |
| 2. | Specify the classification-group coluumn in your Winsteps control file DIF = 9 |
| 3. | Output Table 30 In your control file: TFILE=* 30 * or from the Output Tables menu. |
The DIF plot is a useful guideline where to look. Table 30.1 is decisive. Look at the two "Person Classes" of interest to you (columns 1 and 4). And at the item (row) of interest. This gives you the exact size and significance of the DIF.
Then (see Table below)
1) we need the DIF to be big enough in size to be noticeable (usually size > 0.5 logits)
2) we need the DIF to be significant enough not to have happened by chance (usually t > 2.0)
But both (1) and (2) are general guidelines, which should be adjusted to your situation, in particular the control you have over your data. Most DIF rules are constructed for tightly controlled educational tests. But QOL data is much less controlled, so we must adjust our DIF criteria accordingly. We need to consider whether the DIF is likely to continue into other samples, or is the DIF only an accident of this dataset?
What is DIF?
Differential Item Functioning, DIF, indicates that one group of respondents is scoring better than another group of respondents on an item (after adjusting for the overall scores of the respondents.)
This could mean
1. One group is performing at its usual "attitude/ability" level, the other is performing better than usual.
2. One group is performing at its usual "attitude/ability" level, the other is performing worse than usual.
3. The item has its usual difficulty for one group, but is more difficult than usual for the other.
4. The item has its usual difficulty for one group, but is easier than usual for the other.
5. ...... etc.
The statistics cannot distinguish between these meanings. Unfairness comes in when it is thought that the items are selected (accidentally or deliberately) to favor one group or disadvantage the other. This can happen for any of reasons 1-5 and more. When presenting DIF results in a political context, DIF is usually presented as 3. with the "other" group being the politically-disadvantaged group.
DIF statistical significance is influenced by:
1. Size of DIF effect.
2. Size of classification groups.
It is largely uninfluenced by model fit.
ETS DIF Category |
DIF Contrast (Logits) |
DIF Statistical Significance |
C = moderate to large |
|DIF| >=1.5 / 2.35 = 0.64 |
p( |DIF| ≤1/2.35 = 0.43) < .05 |
B = slight to moderate |
|DIF| >= 1/2.35 = 0.43 |
p( |DIF| <0) < .05 |
A = negligible |
|
|
C-, B- = DIF against focal group |
||
ETS (Educational Testing Service) use Delta units. 1 logit = 2.35 Delta units. 1 δ = (4/1.7) ln(α), where α is the odds-ratio. |
||
Zwick, R., Thayer, D.T., Lewis, C. (1999) An Empirical Bayes Approach to Mantel-Haenszel DIF Analysis. Journal of Educational Measurement, 36, 1, 1-28 |
||
Suggestion: If your research will be evaluated by a reviewer and you have complete dichotomous data, then report the Mantel-Haenszel statistics .
Minimum Sample Size
"When there was no DIF, type I error rates were close to 5%. Detecting moderate uniform DIF in a two-item scale required a sample size of 300 per group for adequate (>80%) power. For longer scales, a sample size of 200 was adequate. Considerably larger sample sizes were required to detect nonuniform DIF, when there were extreme FEs or when a reduced type I error rate was required."
N. Scott, P. Fayers, N. Aaronson, A. Bottomley, A. de Graeff, M. Groenvold, C. Gundy, M. Koller, M. Petersen, M. Sprangers. (2009). A simulation study provided sample size guidance for differential item functioning (DIF) studies using short scales. Journal of Clinical Epidemiology, Volume 62, Issue 3, Pages 288-295. www.jclinepi.com/article/S0895-4356%2808%2900158-3/abstract
If we want to compare reasonably robust item difficulties for each sub-group in a somewhat informal way, then 30 per group-classification: www.rasch.org/rmt/rmt74m.htm
Computation
The DIF (differential item functioning) or DPF (differential person functioning) analysis proceeds with all items and persons, except the item or person currently targeted, anchored at the measures from the main analysis (estimated from all persons and items, including the currently targeted ones). The item or person measure for the current classification is then computed, along with its S.E. Mathematically, it is unlikely that no bias effects will be observed, or that bias sizes will cancel out exactly. The DIF contrast in Table 30 and 31 is the difference between the DIF sizes, and is a log-odds estimate, equivalent to a Mantel-Haenszel DIF size. The t is the DIF contrast divided by the joint S.E. of the two DIF measures. It is equivalent to the Mantel-Haenszel significance test, but has the advantage of allowing missing data. This analysis is the same for all item types supported by Winsteps (dichotomies, rating (or partial credit) scales, etc.).
To replicate this with Winsteps yourself:
From a run of all the data, produce a PFILE=pf.txt and a SFILE=sf.txt
Then for each person classification of interest:
PAFILE=pf.txt
SAFILE=sf.txt
PSELECT=?????X ; to select only the person classification of interest
IFILE = X.txt ; item difficulties for person classification on interest
CONVERGE=L ; only logit change is used for convergence
LCONV=0.005 ; logit change too small to appear on any report.
Do this for each class.
The IFILE= values should match the values shown in Table 30.2
To graph the ICCs for different non-uniform DIF for different classification groups on the same plot, see DIF item characteristic curves.
Classification sizes
There is no minimum size, but the smaller the classification size (also called reference groups and focal groups), the less sensitive the DIF test is statistically. Generally, results produced by classifications sizes of less than 30 are too much influenced by idiosyncratic behavior to be considered dependable.
Do DIF effects sum to zero?
If the DIF person-classification groups have the same average ability and roughly the same size (see Table 28 - PSUBTOTAL=), then the DIF effects will sum to near 0.0. But if the DIF groups differ in average ability or differ in size, then the DIF terms will not cancel out. This is because the baseline measure is the average of the observed performances.
Example: There are 10 boys and 1000 girls. The baseline measure will be close to the girls' DIF measure. The boys' DIF measure can be considerably different.
Effect of imprecision in person or item estimates
This computation treats the person measures (for DIF) or the item measures (for DPF) as point estimates (i.e., exact). You can inflate the reported standard errors to allow for the imprecision in those measures. Formula 29 of Wright and Panchapakesan (1969), www.rasch.org/memo46.htm, applies. You will see there that, for dichotomies, the most by which imprecision in the baseline measures can inflate the variance is 25%. So, if you multiply the DIF/DPF point estimate S.E. by sqrt(1.25) = 1.12 (and divide the t by 1.12), then you will be as conservative as possible in computing the DIF/DPF significance.
Impact on Person/Item Measurement
Unless DIF/DPF is large and mostly in one direction, the impact of DIF/DPF on person/item measurement is generally small. Wright & Douglas (1976) Rasch Item Analysis by Hand. "In other work we have found that when [test length] is greater than 20, random values of [item calibration misestimation] as high as 0.50 have negligible effects on measurement."
Wright & Douglas (1975) Best Test Design and Self-Tailored Testing. "They allow the test designer to incur item discrepancies, that is item calibration errors, as large as 1.0. This may appear unnecessarily generous, since it permits use of an item of difficulty 2.0, say, when the design calls for 1.0, but it is offered as an upper limit because we found a large area of the test design domain to be exceptionally robust with respect to independent item discrepancies."
If DIF is large, then splitting the DIF'ed item may be productive.
DIF/DPF statistical significance
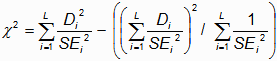
Table 30.1 shows pair-wise test of the statistical significance of DIF across classes. Table 30.2 shows statistical significance of DIF for a class against the average difficulty. A statistical test for DIF for multiple classes on one item is a "fixed effects" chi-square of homogeneity. For L measures, Di, with standard errors SEi, a test of the hypothesis that all L measures are statistically equivalent to one common "fixed effect" apart from measurement error is a chi-square statistics with L-1 d.f. where p>.05 (or >.01) indicates statistically equivalent estimates.
Non-Uniform DIF or DPF
To investigate this with the Winsteps, include in the item or person label a stratification variable, indicating, low, middle or high performers (or item difficulties). Use this is the classification variable for DIF= or DPF=. Also view the Graphs menu, Non-uniform DIF.
DIF and Extreme Scores
DIF: For non-extreme-score items, extreme-score persons are excluded.
For extreme-score items, everyone is included, but no DIF is computed:
------------------------------------------------------------------------------------------------------
| KID OBSERVATIONS BASELINE DIF DIF DIF DIF DIF TAP |
| CLASS COUNT AVERAGE EXPECT MEASURE SCORE MEASURE SIZE S.E. t Prob. Number Name |
|----------------------------------------------------------------------------------------------------|
Item 1 is extreme (everyone succeeded on it). All persons are included in the DIF report
| M 17 1.00 1.00 -6.52 .00 -6.52 .00 .00 .00 1.000 1 1-4 |
Item 4 is not extreme. Extreme persons (one) is excluded:
| M 16 1.00 .96 -4.38 .04 -4.85> -.47 1.57 -.30 .7695 4 1-3-4 |
DPF: For non-extreme-score persons, extreme-score items are excluded.
For extreme-score persons, every items is included, but no DPF is computed:
The Mathematics of Winsteps DIF and DPF Estimation
A first approximation is:
size of interaction (in logits) = (sum of observational residuals) / (sum of model observational variances)
For each observation, its residual and its model variance are reported in the XFILE=
The DIF and DPF are estimated as minor effects in a logit-linear procedure. The major effects are the person abilities, item difficulties, and rating scale structures. The approach in Winsteps parallels the use of logit models in Mellenbergh, G. J. (1982). Contingency table models for assessing item bias. Journal of Educational Statistics, 7, 105-107; Van Der Flier, H., Mellenbergh, G. J., Adèr, H. J. & Wijn, M. (1984). An iterative item bias detection method. Journal of Educational Measurement, 21, 131-145; Kok, F. G., Mellenbergh, G. J. & Van Der Flier, H. (1985). Detecting experimentally induced item bias using the iterative logit method. Journal of Educational Measurement, 22, 295-303.
Algebraically, the general model is in two stages:
Stage 1: Log ( Pnij / Pni(j-1) ) = Bn - Dgi - Fgj
Where Bn is the ability of person n, Dgi is the difficulty of person i in classification g, Fgj is the Rasch-Andrich threshold measure of category j relative to category j-1 for items in item-grouping g.
For the Rasch dichotomous model, all items are in the same item-grouping (so that g is omitted), and there are only two categories, with F1=0.
For the Andrich rating-scale model, all items are in the same item-grouping (so that g is omitted), and there are more than two categories, with sum(Fj)=0.
For the Masters' partial-credit model, each item is in its own item-grouping (g=i), and there are more than two categories, with sum(Fij)=0. To reparameterize into the conventional partial-credit model formulation, Di + Fij = Dij.
Estimates of Bn, Dgi and Fgj are obtained.
Stage 2: Table 30: For person-subsample (ps) DIF: Log ( Pnij / Pni(j-1) ) = Bn - Dgi - Fgj - DIF(ps)i
Table 31: For item-subsample (is) DPF: Log ( Pnij / Pni(j-1) ) = Dn - Dgi - Fgj + DPF(is)n
Table 33: For person-subsample item-subsample (ps)(is) DIPF: Log ( Pnij / Pni(j-1) ) = Bn - Dgi - Fgj + DIPF(ps)(is)
Estimates of bn, dgi and fgj anchored (fixed) from stage 1. The estimates of DIF, DPF or DIPF are the maximum likelihood estimates for which the marginal residuals for the subsamples from the stage 1 analysis are the sufficient statistics. All these computations are as sample-distribution-free as is statistically possible, except when the subsampling is based on the sample-distribution (e.g., when persons are stratified into subsamples according to their ability estimates.)
Different forms of DIF detection
A cross-plot of item difficulties derived from independent runs of the focal and reference classifying-groups, is basically reporting "Is the instrument working differently for the two sample classifications?", and, if so, "Where are the most conspicuous differences?" In the old days, when much analysis was done by hand, this would identify which items to choose for more explicitly constructed DIF tests, such as Mantel-Haenszel. From these plots we can get approximate DIF t-tests. This approach is obviously useful - maybe more useful than the item-by-item DIF tests. But it allows DIF in an item to change the person measures, and to alter the difficulties of other items and to change the rating (or partial credit) scale structure. To apply this "differential test functioning" approach to DIF detection, perform independent analyses of each sample class, produce IFILE= and cross-plot the measures using the Compare Statistics plot.
But, it is the item-by-item DIF tests that have traditional support. So, for these, we need to hold everything else constant while we examine the DIF of each item. This is what Mantel-Haenszel does (using person raw scores), or the Winsteps DIF Table does (using person measures).
The Winsteps DIF table is equivalent to constructing a "ruler" based on the persons, and measuring the items on it, first for one person-group, then for the other person-group. The equivalent procedure is:
(a) The joint run of all person-group classifications, producing anchor values for person abilities and rating (or partial credit) scale structure.
(b) The classification A run with person abilities and rating (or partial credit) scale structure anchored at their joint values to produce person-group classification A item difficulties.
(c) The classification B run with person abilities and rating (or partial credit) scale structure anchored at their joint values to produce person-group classification B item difficulties.
(d) Pairwise item difficulty difference t-tests between the two sets of item difficulties (for person-group classifications A and B).
Lord's Chi-square DIF method takes a different approach, automatically looking for a core of stable items, but it is accident-prone and appears to overdetect DIF. In particular, if items were slightly biased, 50% against boys and 50% against girls, it would be accidental which set of items would be reported as "unbiased" and which as "biased".
Mantel-Haenszel method. See Mantel and Mantel-Haenszel DIF statistics
ANOVA method. This can be facilitated by Winsteps.
(1) Identify the relevant demographic variable in the person label, and set ITEM1= at the variable, and NAMLEN=1.
(2) Perform a standard Winsteps analysis
(3) Use USCALE=, UMEAN= and UDECIM= to transform the person measures into convenient "class intervals": integers with lowest value 1, and highest value 10 for 10 class intervals.
(4) Write out an XFILE= selecting only:
person measure (class interval)
standardized residual
person label (demographic variable)
(5) Read this file into your statistics software.
(6) Transform the demographic variable into 1 and 2.
(7) Perform the "fully randomized" ANOVA with standardized residual as the dependent variable, and person measure and person label as the independent variables.
Two-Stage or Multiple-Stage DIF
Zenisky, A. L., Hambleton, R. K., & Robin, F. (2003). Detection of differential item functioning in large-scale state assessments: A study evaluating a two-stage approach. Educational and Psychological Measurement, 63, 51-64.
Stage 1: perform a standard DIF analysis Winsteps Table 30.
Stage 2: for items identified with DIF in Stage 1, say items 8, 10 ,14, give them a weight of zero using IWEIGHT=,
IWEIGHT=*
8 0
10 0
14 0
*
reanalyze the data and produce Winsteps Table 30.
This will show the DIF for all items (include 8, 10, 14) but using the purified scoring.
Resolving DIF
There are several tactics when DIF is discovered.
1. Ignore it as inherent in the measurement system. For instance, in a test of English as a Second Language, different items will exhibit DIF for speakers of different native languages, depending on the relationship of those languages to English. When constructing such tests, content experts should try to balance the DIF across the major groups, but this can never be done perfectly.
2. Remove the item (perhaps rewriting it). This is when the DIF is seen to be a confounding factor which overwhelms the intention of the item. For instance, a mathematics word problem which uses a technical cooking or car-mechanics term better known to girls or boys. IDELETE=
3. Treat the data for one DIF group as missing data. For instance, if a generally good item is misunderstood by speakers of a specific dialect of English, then make the item missing data for them. IPRFILE=
4. Split the item. Make the item two items, each with active data for one group and missing data for the other group. This maintains the same raw scores, but produces different measures for each group. FORMAT= and IPRFILE=
The decision about which approach to use is often driven by political and legal considerations. So the literature either focuses on the mathematics of DIF remedies or contains case studies of the resolution of DIF under specific conditions.
Most important in resolving DIF is that we can communicate our DIF-resolution process simply, clearly and precisely to our audience. This will remove any feeling of unfairness or bias. "Mathe-magical" approaches to DIF resolution may make some in the audience wonder whether something underhanded is being perpetrated upon them.